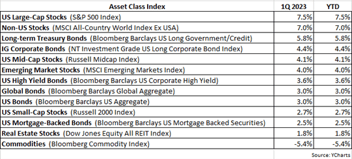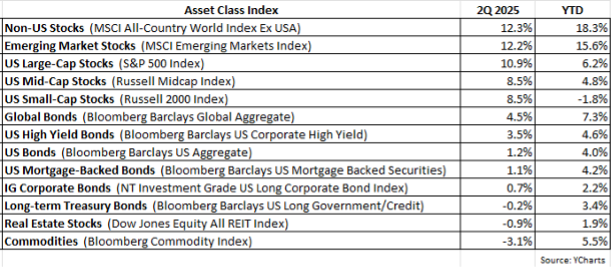
The 2Q started off with “Liberation Day,” when President Trump announced on April 2nd a sweeping package of tariffs, prompting a global market selloff, with the S&P 500 Index plunging by nearly -12%, bottoming on April 8th. It’s then that the White House decided to postpone the tariff increases for 90 days, and equities responded with an impressive relief rally. The S&P 500 proceeded to ascend by 25% off its low, finishing the 2Q with a 10.9% gain. Mid- and small-caps followed a similar pattern, nosediving the first week of April only to reverse course and rip higher to end the quarter with 8.5% gains, respectively.
Not to be outdone, non-US equities enjoyed one of their best quarters in recent memory. The MSCI All-Country World Index ex-USA (ACWX) and the MSCI Emerging Markets Index (EEM) both finished with returns just over 12%. For the year, the ACWX has risen by an eye-opening 18.3%, approximately tripling the YTD return for the S&P 500. A significant reason for the dramatic outperformance of non-US stocks is the continued weakness of the US dollar (USD), which declined by 7% in the quarter. Sentiment towards the USD has grown increasingly hostile as investors worry about the level of US debt and deficits along with the unpredictability of US trade and foreign policy. More discussion on this topic of non-US equities will follow later in this letter.
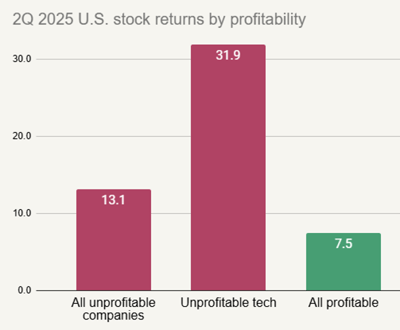
It's worth noting that speculative, low-profitability names have led the stock market rally during the 2Q. For example, in the Russell 1000 Index for the 2nd quarter, the highest beta stocks (top decile) returned 15.6%, whereas the lowest beta stocks (bottom decile) had a negative return of -3.6%. And as the graphic below shows, unprofitable companies (no earnings) posted a 13.1% return in the 2Q, compared to just a 7.5% return for profitable companies.
Additionally, I distinctly recall two specific periods when high-beta, low-quality, unprofitable stocks performed very well — in 2000 and 2009. Those are two very different time periods! 2009 followed the devastating 2008 market selloff, marking the start of a new bull market. Whereas 2000 was nearly the opposite, a time when the market had ripped higher in 1999 and "junk" stocks enjoyed their last hurrah during 2000 before rolling over and tanking into 2001. That said, we would argue this recent outperformance of low-quality names is more akin to 2000 than 2009.
Returning to the topic of non-US equities, although the US dollar (USD) has indeed shown signs of recent weakness, the long-term chart shown below helps to put this USD move in better perspective.
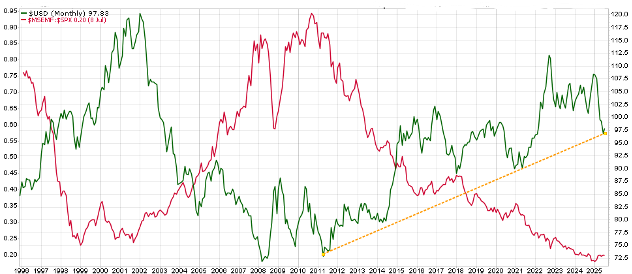
The USD is the green line, and the relative return of the MSCI Emerging Markets Index vs. S&P 500 is the red line. When non-US stocks outperform US stocks, the red line will rise, and vice versa. When non-US stocks underperform US stocks, the red line will decline. Also note that as the green line (USD) declines, the red line tends to rise, meaning non-US stocks tend to outperform US stocks when the USD weakens. We’ve seen this tendency occur so far this year with non-US stocks rocketing past US stocks as the USD erodes in value.
As depicted in the above chart, when the USD was strong from 1996 to 2001, non-US stocks underperformed US stocks (see declining red line). But from 2002-2008, the USD was weak & declining and as expected, non-US stocks outperformed US stocks (see rising red line). Since 2010, the USD has steadily trended higher, and over the last 15 years, US stocks have performed much better than non-US stocks.
Some additional points:
- These macro trends tend to last several years.
- That said, it doesn't necessarily pay to be (too) early because, as evident in the chart, there are several times when it may appear a trend is changing, only to not.
- Notice the USD is still arguably within an uptrend — this despite the recent weakness.
- Also notice that although the red line has risen a bit recently (reflecting non-US doing well in 2025 so far), this outperformance barely registers when viewing the red line from 2010 to present.
Earlier this year, we increased our exposure to non-US equity, further reducing our underweight stance. I've been waiting years to be much more aggressive with non-US exposure, but have held off (fortunately) because the above chart has yet to show a meaningful change in USD trend, thus avoiding getting whip sawed.
We realize the financial headlines are "blaring" how well non-US equities are doing, but we’re sticking with our discipline/process. As I've written in the past, the S&P 500 (US large caps) will likely not be the big winner over the next 5-10 years, as it has been over the last 10 years. I would expect non-US stocks to be a prime contender for that #1 spot. I'm just waiting for more conclusive signals to more aggressively increase our exposure.
With respect to client portfolios, we remain defensively positioned, as we are always mindful and vigilant about preserving capital as well as striving to achieve significant relative performance gains.
If you have any questions, please feel free to call or email.
The entire team at Measured Wealth wishes to thank you for entrusting us to deliver on your financial goals.
Edward Miller, CFA, CMT
Chief Investment Officer
Measured Wealth Private Client Group
Important Disclosures
Historical data is not a guarantee that any of the events described will occur or that any strategy will be successful. Past performance is not indicative of future results.
Returns citied above are from various sources including Factset, Bloomberg, Russell Associates, S&P Dow Jones, MSCI Inc., The St. Louis Federal Reserve and Y-Charts, Inc. The content is developed from sources believed to be providing accurate information. The information in this material is not intended as tax or legal advice. Please consult legal or tax professionals for specific information regarding your individual situation. The opinions expressed and material provided are for general information and should not be considered a solicitation for the purchase or sale of any security. Investing involves risks, including possible loss of principal. Please consider the investment objectives, risks, charges, and expenses of any security carefully before investing.
In order to provide effective management of your account, it is important that we have current information regarding your financial status and circumstances. Please contact us in writing at 303 Islington Street, Portsmouth, NH 03801 if you have any changes in your financial situation or investment objectives, and whether you wish to impose any reasonable restrictions on the management of the account or reasonably modify existing restrictions.
Measured Wealth Private Client Group, LLC is an investment adviser located in Portsmouth, New Hampshire. Measured Wealth Private Client Group, LLC is registered with the Securities and Exchange Commission (SEC). Registration of an investment adviser does not imply any specific level of skill or training and does not constitute an endorsement of the firm by the Commission. Measured Wealth Private Client Group, LLC only transacts business in states in which it is properly registered or is excluded or exempted from registration.
This publication is provided to clients and prospective clients of Measured Wealth Private Client Group, LLC for general informational and educational purposes only. It does not: (i) consider any person's individual needs, objectives, or circumstances; (ii) contain a recommendation, offer, or solicitation to buy or sell securities, or to enter into an agreement for investment advisory services; or (iii) constitute investment advice on which any person should or may rely. Past performance is no indication of future investment results. This publication is based on information obtained from third parties. While Measured Wealth Private Client Group, LLC seeks information from sources it believes to be reliable, Measured Wealth Private Client Group, LLC has not verified, and cannot guarantee the accuracy, timeliness, or completeness, of the third-party information used in preparing this publication. The third-party information and this publication are provided on an “as is” basis without warranty.
This publication may contain forward-looking statements relating to the objectives, opportunities, and the future performance of the U.S. market generally. Forward-looking statements may be identified by the use of such words as; “should,” “estimated,” “potential” and other similar terms. Examples of forward-looking statements include, but are not limited to, estimates with respect to financial condition, results of operations, and success or lack of success of any particular investment strategy. All are subject to various factors, including, but not limited to general and local economic conditions, changing levels of competition within certain industries and markets, changes in interest rates, changes in legislation or regulation, and other economic, competitive, governmental, regulatory and technological factors affecting a portfolio's operations that could cause actual results to differ materially from projected results. Such statements are forward-looking in nature and involve a number of known and unknown risks, uncertainties and other factors, and accordingly, actual results may differ materially from those reflected or contemplated in such forward-looking statements. Prospective investors are cautioned not to place undue reliance on any forward-looking statements or examples. None of Measured Wealth Private Client Group, LLC or any of its affiliates or principals nor any other individual or entity assumes any obligation to update any forward-looking statements as a result of new information, subsequent events or any other circumstances. All statements made herein speak only as of the date that they were made.