By Edward Miller, CFA®, CMT®
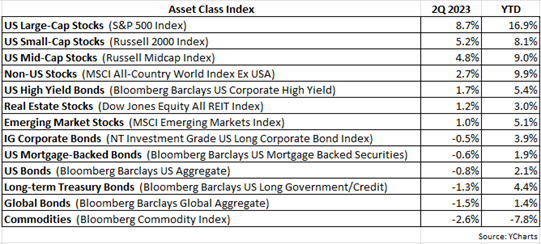
As I wrote in our 1Q letter, 2023 continues to be a near mirror opposite of 2022. Whereas through the 2Q of last year the S&P 500 was down -20%, this year the S&P 500 is up 16.9% through the 2Q. Technology, Consumer Discretionary and Communication Services were the three worst performing equity sectors last year and yet they’re the best performing sectors so far in 2023. Even US bonds, which had their worst year in history last year, are up a respectable 2.1% through the 2Q. The best performing asset class last year, commodities, continues to be the worst performer this year, down nearly -8% YTD.
So one may reasonably ask, “What is going on here? Why all these reversals in performance less than one year later?” Initially, I can’t help but recall what was once told to me many years ago, that the market will do whatever it can to prove most people wrong most of the time. I laughed when I first heard this adage, but admittedly there’s much truth behind it. Investors as a group (“the market”) are always trying to digest current info and data and then discount the future based on this info/data. When the info/data changes, so too do markets. Last year, inflation continued to rise, the Fed was raising rates and it was increasingly likely a recession was imminent. And yet this year has seen inflation subsiding and the Fed indicating an end to rate hikes is near. In response, duration-sensitive growth equities (e.g. technology and consumer cyclicals) have surged, bonds have recovered and most commodities have retreated from their 2022 peak levels. It’s as if suddenly investors were convinced that the ever-elusive “soft landing” scenario for the economy has become a real achievable possibility.
With the change in years turning market sentiment from bearish to bullish, it must also be mentioned that the splashy debut of artificial intelligence (AI) late last year in the form of ChatGPT, and then Google’s Bard earlier this year, helped to further fuel the rapid shift in risk appetite for investors. Any company perceived to greatly benefit from AI, with accelerating future growth to come, likely saw their stock price liftoff earlier this year.
In fact, so far in 2023, this AI-effect has been clearly evident in the performance of the S&P 500 Index. Through the 2Q, the bulk of the positive performance for the S&P 500 can be attributed to just seven AI-related stocks: Apple, Microsoft, NVIDIA, Meta (Facebook), Amazon, Tesla and Alphabet (Google). The following chart best displays the degree to which these seven stocks have become glaring outliers within the Index.
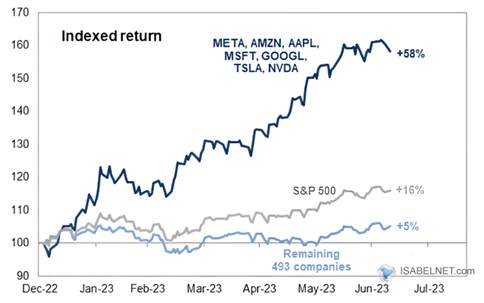
Collectively, the “Magnificent Seven,” as they’ve been dubbed, have risen 58% YTD compared to just a 5% gain for the remaining 493 stocks in the S&P 500. Needless to say, such extreme concentration of returns within the Index makes it exceedingly difficult to outperform the benchmark. Not owning any or all of those seven stocks has most likely resulted in underperformance versus the S&P 500.
Frankly, I cannot recall a time when so few stocks fared this well in the S&P 500 compared to the other Index constituents. A similar phenomenon did occur during the dot-com bubble of 2000, when the internet was expected to deliver massive growth to several technology companies and their stock prices soared as investors front-loaded extremely optimistic assumptions into their valuations. Unfortunately, we know what happened next, and unless it’s different this time (which it usually is not), I remain very skeptical that this huge performance disparity can sustain.
As written in our 1Q investment letter, “Our client portfolios have been positioned defensively since late 2021 and have remained so to date.” Although we recognize and respect the more bullish message being sent by the S&P 500, many indicators we follow that historically have proven to be very prescient remain quite bearish. As an example, the following exhibit from ClearBridge Investments lists twelve key economic indicators that usually turn red or negative before a recession.
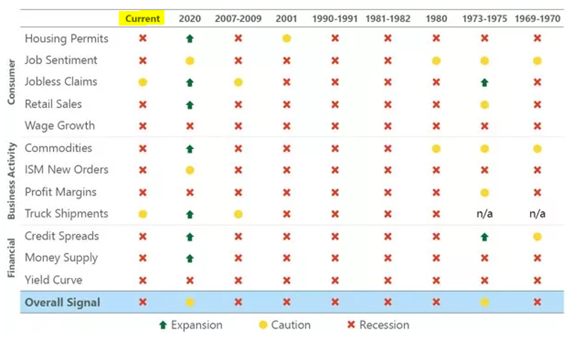
Notice the current status of the twelve indicators looks very similar to past recessions (excluding the very brief COVID-related recession in 2020).
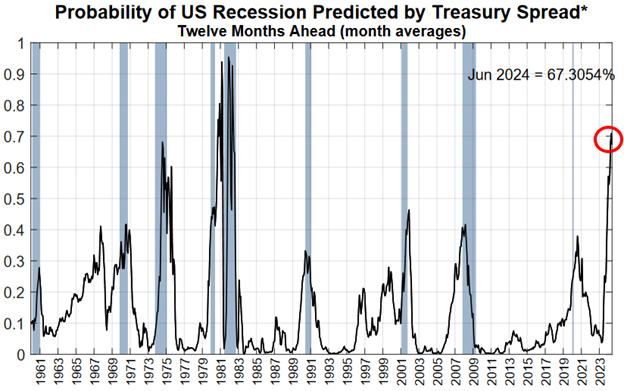
Also, the NY Fed’s recession gauge recently hit a 40-year high, currently forecasting a 67% likelihood of a recession within twelve months.
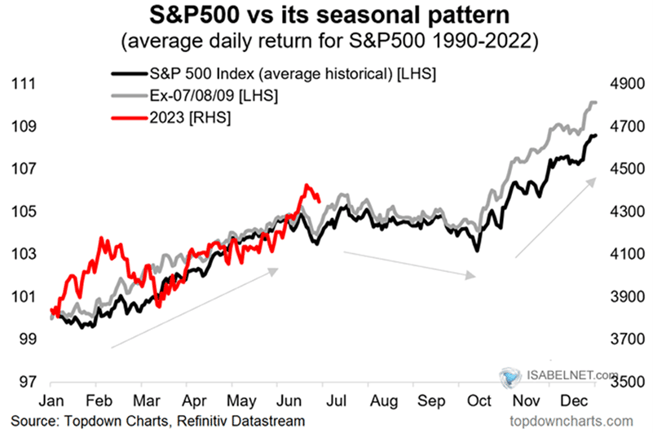
Lastly, seasonally the market is entering its most difficult period in the calendar year. As the following chart depicts, the S&P 500 rally this year (red line) is likely to face some headwinds over the next few months, at least based on seasonal tendencies.
As always, if you have any questions, please feel free to call or email. The entire team at Measured Wealth wishes to thank you for entrusting us to deliver on your financial goals.

Ed Miller, CFA, CMT
Chief Investment Officer
Measured Wealth Private Client Group
Important Disclosures
Historical data is not a guarantee that any of the events described will occur or that any strategy will be successful. Past performance is not indicative of future results.
Returns citied above are from various sources including Factset, Bloomberg, Russell Associates, S&P Dow Jones, MSCI Inc., The St. Louis Federal Reserve and Y-Charts, Inc. The content is developed from sources believed to be providing accurate information. The information in this material is not intended as tax or legal advice. Please consult legal or tax professionals for specific information regarding your individual situation. The opinions expressed and material provided are for general information and should not be considered a solicitation for the purchase or sale of any security. Investing involves risks, including possible loss of principal. Please consider the investment objectives, risks, charges, and expenses of any security carefully before investing.
In order to provide effective management of your account, it is important that we have current information regarding your financial status and circumstances. Please contact us in writing at 303 Islington Street, Portsmouth, NH 03801 if you have any changes in your financial situation or investment objectives, and whether you wish to impose any reasonable restrictions on the management of the account or reasonably modify existing restrictions.
Measured Wealth Private Client Group, LLC is an investment adviser located in Portsmouth, New Hampshire. Measured Wealth Private Client Group, LLC is registered with the Securities and Exchange Commission (SEC). Registration of an investment adviser does not imply any specific level of skill or training and does not constitute an endorsement of the firm by the Commission. Measured Wealth Private Client Group, LLC only transacts business in states in which it is properly registered or is excluded or exempted from registration.
This publication is provided to clients and prospective clients of Measured Wealth Private Client Group, LLC for general informational and educational purposes only. It does not: (i) consider any person's individual needs, objectives, or circumstances; (ii) contain a recommendation, offer, or solicitation to buy or sell securities, or to enter into an agreement for investment advisory services; or (iii) constitute investment advice on which any person should or may rely. Past performance is no indication of future investment results. This publication is based on information obtained from third parties. While Measured Wealth Private Client Group, LLC seeks information from sources it believes to be reliable, Measured Wealth Private Client Group, LLC has not verified, and cannot guarantee the accuracy, timeliness, or completeness, of the third-party information used in preparing this publication. The third-party information and this publication are provided on an “as is” basis without warranty.
This publication may contain forward-looking statements relating to the objectives, opportunities, and the future performance of the U.S. market generally. Forward-looking statements may be identified by the use of such words as; “should,” “estimated,” “potential” and other similar terms. Examples of forward-looking statements include, but are not limited to, estimates with respect to financial condition, results of operations, and success or lack of success of any particular investment strategy. All are subject to various factors, including, but not limited to general and local economic conditions, changing levels of competition within certain industries and markets, changes in interest rates, changes in legislation or regulation, and other economic, competitive, governmental, regulatory and technological factors affecting a portfolio's operations that could cause actual results to differ materially from projected results. Such statements are forward-looking in nature and involve a number of known and unknown risks, uncertainties and other factors, and accordingly, actual results may differ materially from those reflected or contemplated in such forward-looking statements. Prospective investors are cautioned not to place undue reliance on any forward-looking statements or examples. None of Measured Wealth Private Client Group, LLC or any of its affiliates or principals nor any other individual or entity assumes any obligation to update any forward-looking statements as a result of new information, subsequent events or any other circumstances. All statements made herein speak only as of the date that they were made.