By Edward Miller, CFA®, CMT®
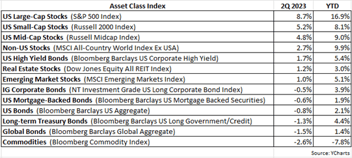
Compared to 1Q performance earlier this year, 2Q returns for most equity markets went from bad to worse. The bellwether S&P 500 Index declined by -16.1% this past quarter, following a -4.6% return in the 1Q, and is down -20% YTD through June. Smaller-cap US stocks also suffered significant losses
in the 2Q as the Russell Midcap Index declined by -16.8% and the Russell 2000 Index fell by -17.2%, with both indices sinking below -20% YTD. Unfortunately, US stocks are now technically in a bear market, which generally is defined as a period when equites have fallen 20% or more from their peak. At least non-US stocks fared relatively better than their US counterparts in the quarter as the MSCI All-Country World Index ex-USA declined by -13.5% and the MSCI Emerging Markets Index fell by -11.3%, with both indices managing to remain above the -20% threshold for the year.
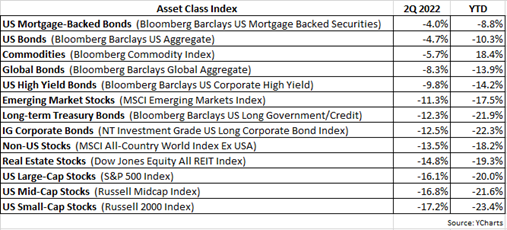
Although fixed-income asset classes continue to struggle this year, their declines in the 2Q were relatively less severe than equities, helping to serve as a much-needed ballast in client portfolios. The Barclays US Aggregate Bond Index and the Barclays Global Aggregate Bond Index fell by -4.7% and -8.3% respectively, quite a bit better than the S&P 500’s decrease of -16.1%. However, both of these bond indices are down double-digits for the year, and riskier bond categories such as global and high yield bonds are down more than the S&P 500 YTD.
2022 has been an especially difficult year for investors because apart from commodities, there’s really been nowhere to hide to avoid losses. In fact, through June, only 10% of all US-listed ETFs had positive trailing 12-month returns – the lowest percentage since the market lows of 2008. Even energy stocks, which have been seemingly the sole bright spot this year for US equities, plunged by -17% in the month of June (as reflected by the Energy Select Sector ETF, ticker XLE), but are still up 31.4% for the year.
OK, so where do things go from here? Not to dodge the question, but the answer is unknowable at this point. To repeat what we said in our 1Q 2022 investment letter:
An outcome of the Fed raising rates is the economy tends to slow down and even risks entering a recession. The proverbial “soft landing” for the economy is always the Fed’s goal but is almost never achieved. Instead, the Fed is typically “behind the curve” with inflation, meaning it’s arguably late in starting rate hikes and as a result goes too far with the number of rate increases, draining precious liquidity from the financial system and eventually pushing the economy into recession.
Whether or not the Fed successfully engineers a “soft landing” for the economy – always a very elusive goal – remains to be seen. US GDP in the 1Q was negative and the same is forecasted for the 2Q, which would technically qualify as a recession (two consecutive quarters of negative GDP). But a recession is usually characterized by high or rising unemployment and at least so far that has not occurred, with the current unemployment rate at 3.6%, near its 50-year low. Also, typically the economy is pushed into a recession as consumers significantly curtail their spending, and although recent data shows evidence of a slowdown in consumer expenditures, it remains at a healthy level.
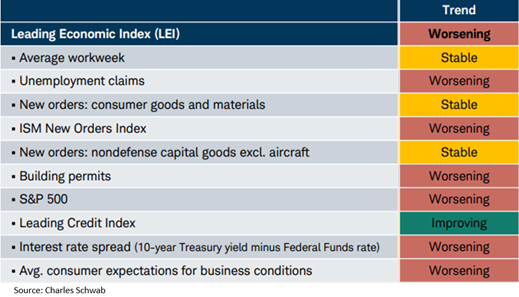
What concerns us most are leading or forward-looking economic indicators, which increasingly suggest a recession is the most likely outcome. The economy may appear to be fairly robust currently, but financial markets are discounting mechanisms which attempt to price today what 6-12 months into the future will look like. The S&P 500 being down -20% through June could be discounting a recession on the horizon. As shown in the following exhibit, The Conference Board tracks ten leading economic indicators (the S&P 500 being one) and unfortunately the trend for most of these indicators is worsening, inferring risk of a recession is growing.
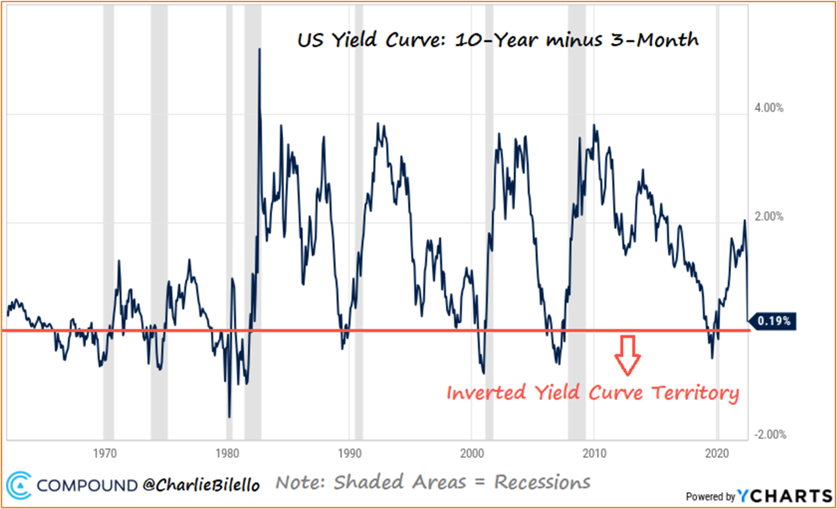
One of these leading indicators, the Treasury yield curve, has one of the best long-term track records for predicting recessions. When the 10-year Treasury yield falls below the 3-month Treasury yield, the yield curve becomes inverted, a condition that has preceded the last eight US recessions. The following chart shows the 10Y/3M yield curve since 1960 with recessions shaded grey, and while the yield curve is not yet inverted (below the orange line), it’s very close.
Admittedly, these indicators portray a rather dismal economic picture, but there are silver linings to be found. Perhaps the most encouraging sign is inflation appears either to be peaking or has already peaked.
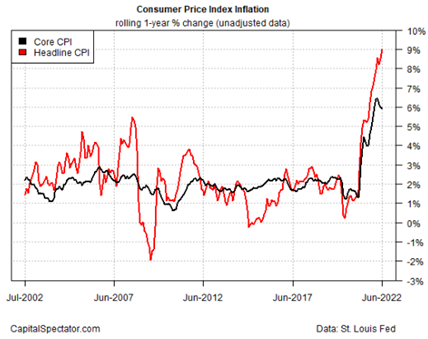
The chart to the left depicts Headline CPI vs. Core CPI. Headline CPI is the inflation figure most commonly reported in the media. Core CPI is the Headline CPI excluding food & energy prices. The Fed tends to focus more on Core CPI, knowing that food & energy prices can be very volatile and can distort the overall trend in inflation. Also, as can be seen in the chart, Core CPI tends to lead Headline CPI, and notice the black line (Core CPI) is currently lower than Headline CPI (red line) and appearing to turn downward. If Core CPI continues to head south, we should soon see Headline CPI do the same.
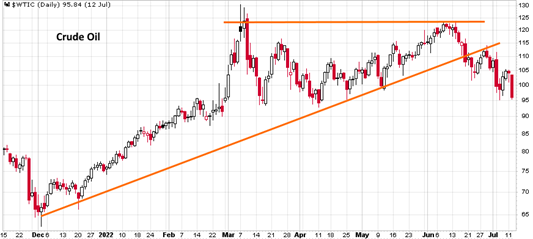
The price of crude oil is a widely followed surrogate for inflation and it also appears to be showing signs of peaking and working lower.
As shown in the chart here, the price of oil hit a high of approximately $125 in early March, and once again approached
that $125 level last month, creating what appears to be a
double-top formation. The price has since broken down through
the rising orange trend line and currently is below the key price level of $100.
Assuming inflation has indeed peaked and will recede over the next several months, pressure on the Fed to raise interest rates should likewise recede or dissipate. In fact, as with inflation, there are emerging indications that interest rates may have peaked and could soon start to trend lower.
The following chart shows the relative performance of the KBW Bank Index vs. the S&P 500 (red line) and the 10-year Treasury yield (blue line):
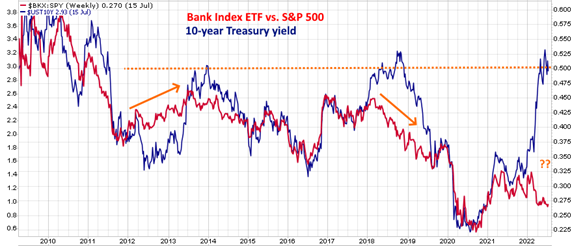
The relative return of the bank index (red line) tends to lead the 10-year Treasury yield (blue line). For example, in 2012, the relative return of the bank index was trending higher and although the 10-year Treasury yield was then still declining, by 2013 the 10-year yield had reversed course, spiking higher and reaching 3%. And in 2018, the relative return of the bank index was trending lower while the 10-year yield was still rising, but eventually the 10-year yield topped out and plummeted much lower into 2019. Currently, the relative return of the bank index remains in a downtrend, strongly implying that the elevated 10-year Treasury yield should soon start declining.
Another indicator suggesting that interest rates have likely peaked is copper vs. gold.
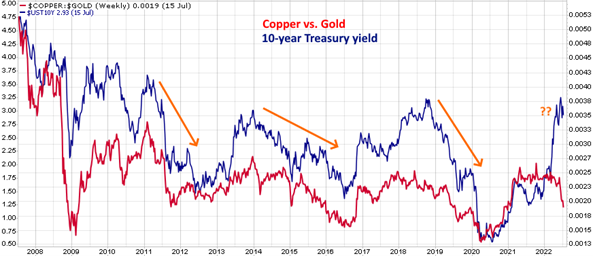
The chart above displays the price of copper vs. gold (red line) and the 10-year Treasury yield (blue line). As with the relative return of the bank index vs. S&P 500, the relative return of copper vs. gold also tends to lead the 10-year Treasury yield. In the past, when copper vs. gold has turned down and moved lower, the 10-year Treasury yield has eventually likewise headed lower. Currently, the copper vs. gold red line is declining, which implies the 10-year yield should soon trend lower.
It’s worth noting that both charts above make intuitive sense. Bank stocks typically do very well when the economy is strong and as a result interest rates are heading higher (which boosts interest earned on bank loans). But if the relative performance of bank stocks is languishing or in a downtrend, it implies the economy is weakening and interest rates are likely to fall. Similarly, the price of copper tends to rise as the economy grows stronger (since it’s an industrial metal), and the price of gold tends to rise when investors are concerned about economic uncertainty and geopolitical risks. When copper falls relative to gold, it implies investors are worried and the economy is weakening, which suggests inflation should recede and interest rates will eventually come down.
The big question remains: Are we heading towards a moderate economic slowdown, i.e. a “soft landing,” OR will the economy enter a recession, which will significantly reduce consumer demand for goods and services, and bring about a rise in unemployment? It’s still too early to discern with any confidence just how much of a slowdown in the economy we will eventually experience.
As has been the case for all of 2022, we continue to be defensively positioned in client portfolios, in large part because in our estimation the risk/reward ratio remains unfavorable. Although equities may not decline much further, odds do favor continued higher volatility – a signature feature of bear markets. Some of the most impressive and eye-opening rallies occur within a bear market, only to then roll over and greatly frustrate anyone who got sucked in. Lastly, stocks will be entering a very weak period seasonally as August and September have historically been the worst two-month period for the S&P 500.
As always, if you have any questions, please feel free to call or email.

Ed Miller, CFA, CMT
Chief Investment Officer
Measured Wealth Private Client Group
Important Disclosures
Historical data is not a guarantee that any of the events described will occur or that any strategy will be successful. Past performance is not indicative of future results.
Returns citied above are from various sources including Factset, Bloomberg, Russell Associates, S&P Dow Jones, MSCI Inc., The St. Louis Federal Reserve and Y-Charts, Inc. The content is developed from sources believed to be providing accurate information. The information in this material is not intended as tax or legal advice. Please consult legal or tax professionals for specific information regarding your individual situation. The opinions expressed and material provided are for general information and should not be considered a solicitation for the purchase or sale of any security. Investing involves risks, including possible loss of principal. Please consider the investment objectives, risks, charges, and expenses of any security carefully before investing.
In order to provide effective management of your account, it is important that we have current information regarding your financial status and circumstances. Please contact us in writing at 303 Islington Street, Portsmouth, NH 03801 if you have any changes in your financial situation or investment objectives, and whether you wish to impose any reasonable restrictions on the management of the account or reasonably modify existing restrictions.
Measured Wealth Private Client Group, LLC is an investment adviser located in Portsmouth, New Hampshire. Measured Wealth Private Client Group, LLC is registered with the Securities and Exchange Commission (SEC). Registration of an investment adviser does not imply any specific level of skill or training and does not constitute an endorsement of the firm by the Commission. Measured Wealth Private Client Group, LLC only transacts business in states in which it is properly registered or is excluded or exempted from registration.
This publication is provided to clients and prospective clients of Measured Wealth Private Client Group, LLC for general informational and educational purposes only. It does not: (i) consider any person's individual needs, objectives, or circumstances; (ii) contain a recommendation, offer, or solicitation to buy or sell securities, or to enter into an agreement for investment advisory services; or (iii) constitute investment advice on which any person should or may rely. Past performance is no indication of future investment results. This publication is based on information obtained from third parties.
While Measured Wealth Private Client Group, LLC seeks information from sources it believes to be reliable, Measured Wealth Private Client Group, LLC has not verified, and cannot guarantee the accuracy, timeliness, or completeness, of the third-party information used in preparing this publication. The third-party information and this publication are provided on an “as is” basis without warranty.
This publication may contain forward-looking statements relating to the objectives, opportunities, and the future performance of the U.S. market generally. Forward-looking statements may be identified by the use of such words as; “should,” “estimated,” “potential” and other similar terms. Examples of forward-looking statements include, but are not limited to, estimates with respect to financial condition, results of operations, and success or lack of success of any particular investment strategy. All are subject to various factors, including, but not limited to general and local economic conditions, changing levels of competition within certain industries and markets, changes in interest rates, changes in legislation or regulation, and other economic, competitive, governmental, regulatory and technological factors affecting a portfolio's operations that could cause actual results to differ materially from projected results. Such statements are forward-looking in nature and involve a number of known and unknown risks, uncertainties and other factors, and accordingly, actual results may differ materially from those reflected or contemplated in such forward-looking statements. Prospective investors are cautioned not to place undue reliance on any forward-looking statements or examples. None of Measured Wealth Private Client Group, LLC or any of its affiliates or principals nor any other individual or entity assumes any obligation to update any forward-looking statements as a result of new information, subsequent events or any other circumstances. All statements made herein speak only as of the date that they were made.