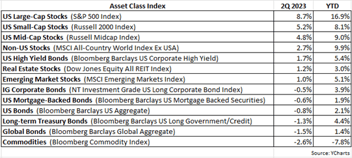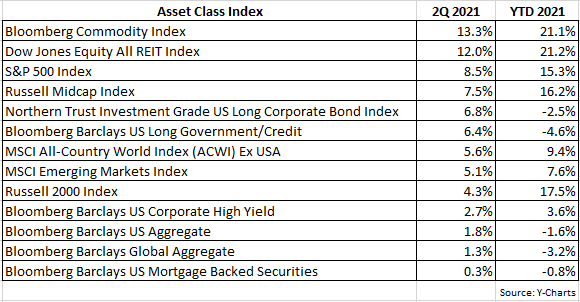
We’re halfway through 2021 and the bull market that started early last summer rolls on. As shown in the table below, the 2Q came to a close with most major asset classes enjoying positive returns. The S&P 500 Index rose by 8.5% in the quarter, besting its 6.2% gain in the 1Q, and is up 15.3% year-to-date (YTD), which is the second-best first half of the year return since 1998. Topping the list as best performing asset classes in both the 2Q and YTD are commodities and real estate equities (REITs), and this makes sense since inflation has become a primary concern for investors this year. Mid- and small-cap stocks cooled off a bit during this recent quarter, posting 7.5% and 4.3% gains respectively. But these moderating returns are not surprising considering mid- and small-cap stocks experienced some of their best returns on record from November 1st through the 1Q, with the S&P Midcap Index returning nearly 30% and the Russell 2000 Index returning nearly 50% in that time.
As for fixed-income markets, bonds recovered in the 2Q as interest rates retreated. The yield on the 10-year Treasury bond peaked at about 1.75% at the end of the 1Q and gradually receded to 1.45% by the end of the 2Q. As a result, long-term Treasuries, which have the greatest sensitivity to interest rate moves, rose by 6.4% in the quarter. The Barclays US Aggregate Bond Index – often regarded as the S&P 500 Index of fixed-income markets – was up 1.8% in the 2Q, but is still negative 1.6% YTD, due in large part to the dramatic rise in Treasury yields earlier this year.
Will rising inflation be transitory or persistent?
This question more than any other has been driving market activity for most of 2021. Inflation has been rising the last few months with the most recent year-over-year change in the CPI coming in at 5.4%. Fed Chair Powell has stated that he believes the pickup in inflation is transitory or a temporary phenomenon, fueled mainly by the reopening of the economy coupled with supply shortages. Yet many economists and financial pundits believe the surge in inflation is not transitory and could be here to stay, conjuring memories of the 1970s.
At this point, we believe it’s too early to make a call either way as current evidence appears to be inconclusive and even conflicting. Those arguing that inflation is a serious concern that won’t go away anytime soon often point to the explosive growth in money supply as a significant contributing factor. The following chart shows the massive spike in money supply growth, the greatest year-over-year percent increase in US history.
The following chart shows the massive spike in money supply growth, the greatest year-over-year percent increase in US history.
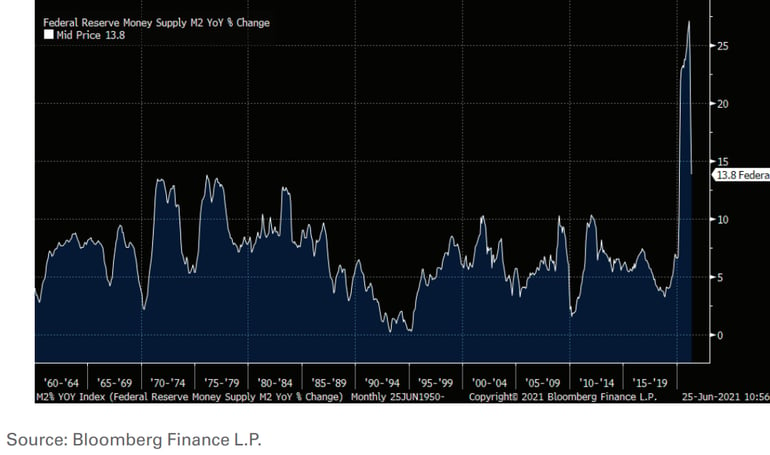
Quantitative easing (QE) by the Fed, whereby the Fed purchases fixed-income securities in the open market, increases the money supply as a means of enhancing liquidity in the financial system. If this monetary stimulus gets overdone, it could overheat the economy, leading to persistent inflation.
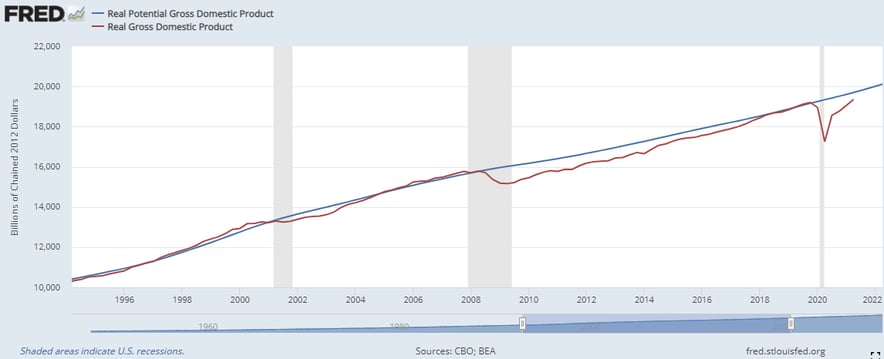
On the other hand, those arguing that the recent rise in inflation is just temporary frequently cite not just the supply chain bottlenecks (such as in the housing, semiconductor and auto industries), which should not last, but also that our economy continues to have ample “slack” to absorb increasing inflationary pressures. Not to get too wonky or technical, slack in the economy is often referred to as the “output gap,” which is the difference between what is actually being produced in the economy versus what the economy has the capacity to produce. As long as output of the economy remains below what it could potentially produce, inflation tends to remain a nonissue. Generally, it’s only when the economy is performing above its sustainable capacity that inflation becomes a meaningful threat. As the chart below shows, the economy remains well below its potential, with real GDP (red line) tracking well below real potential GDP (blue line).
Why is this inflation debate impacting financial markets? Because the Fed’s key tool for combating inflation is interest rate hikes and the rise and fall of the 10-year Treasury yield reflects investors handicapping whether or not the Fed will be forced to raise rates to bring down inflation. In addition, the direction of interest rate movements has a tendency to strongly influence the performance of value vs. growth stocks, as depicted in the following chart.
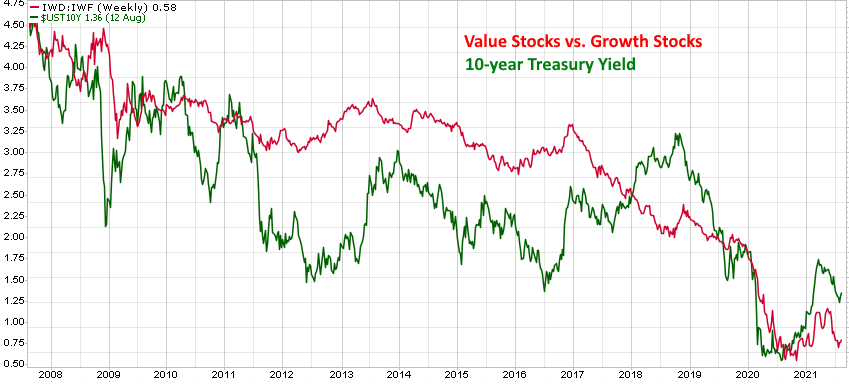
The red line in the chart represents the relative return of the Russell 1000 Value Index vs. the Russell 1000 Growth Index. When the red line is rising, value stocks are outperforming growth stocks, and vice versa, when the red line is declining, growth stocks are outperforming value stocks. The green line is the 10-year Treasury yield and notice the high correlation of the red and green lines. A rising 10-year yield reflects investors believing the economy is heating up and inflation could become a potential problem. Value sectors, like financials and energy, are quite economically sensitive and would benefit from a very strong economy and even moderately-elevated inflation. Growth stocks tend to be less dependent on a strong economy to generate earnings.
Referring once again to the chart, we would argue that the red line tends to lead the 10-year Treasury yield, with the relative return of value vs. growth stocks doing a fairly good job at discounting Treasury yield moves and consequently any looming inflation threat. Value stocks outperformed growth during this past November-May period, but since that time growth stocks have regained their leadership status.
As we already stated, it’s still too early to make a definitive call on inflation and interest rates. Until we’re able to ascertain more clarity on this issue, we intend to maintain a neutral stance when it comes to favoring value or growth stocks.
When will the stock market correct?
Good question! Since the COVID-driven decline of early 2020, stocks have been steadily ascending without suffering a meaningful correction (10% or more decline) at any point along the way. In fact, the S&P 500 has now gone 58 weeks without dipping below its 200-day moving average, one of the longest streaks without a significant correction since 1950.
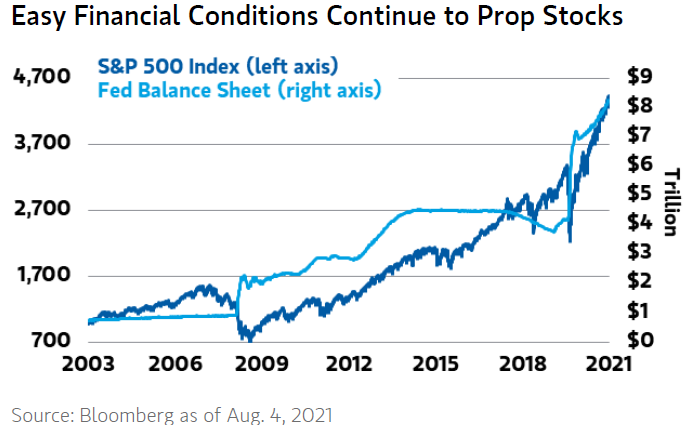
We are arguably overdue for a pullback in equity markets – but the same could be said last month, earlier this year or even late last year. Yes, it’s atypical for stocks to advance for an extended period of time without experiencing at least some form of material dip in prices. However, what’s also atypical and frankly unprecedented is the extraordinary amount of stimulus pumped into the economy by both the federal government and the Fed Reserve. It’s estimated that $5 trillion in federal aid has been enacted to address the repercussions stemming from the pandemic. In addition, last year the Fed Reserve had initiated a massive QE program, buying fixed-income securities and expanding its balance sheet in an effort to keep interest rates low as a means of further boosting financial liquidity and economic growth. To put in perspective, and as shown in the chart below, in January 2020, the Fed’s balance sheet was approximately $4.1 trillion in size and it has since doubled, recently surpassing $8.2 trillion.
The totality of all this stimulus has not only managed to bolster the economy, as it made the fastest recovery out of a recession on record, but it has also worked to expand several equity valuations to very high levels. For example, the Shiller PE ratio (also known as the “CAPE” or cyclically-adjusted P/E ratio) for the S&P 500 has attained one of its highest values in its 150-year history, as shown in the next chart.
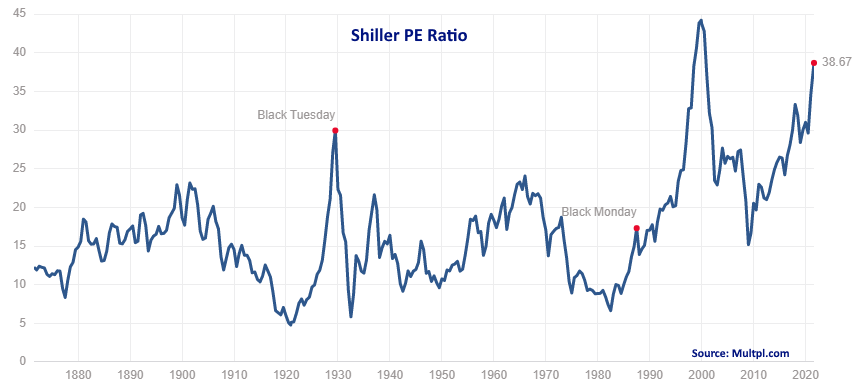
Do such extended valuations suggest selling everything now? That would be an understandable reaction but note in the chart that the Shiller P/E had reached its second highest level in its history in 2018 – when the S&P 500 was approximately 2900, compared to approximately 4300, its value at the end of the 2Q of this year.
Although we do recognize that equity valuations are stretched, the larger point is value metrics on a macro scale are not particularly precise in their timing. Selling everything in 2018 would’ve missed the S&P 500’s nearly 50% appreciation in that time. And again, given the unprecedented amount of stimulus flooding the economy, the always-difficult endeavor of trying to time the market has become even that much more challenging. We consider valuations to be an important input into our investment process, but it’s just one of many that we carefully consider in our weight-of-the-evidence approach.
The team at Measured Wealth wishes you all the best with what remains of the summer. As always, if you have any questions, feel free to call or email.
Ed Miller, CFA, CMT
Chief Investment Officer
Measured Wealth Private Client Group
Important Disclosures
Historical data is not a guarantee that any of the events described will occur or that any strategy will be successful. Past performance is not indicative of future results.
Returns citied above are from various sources including Factset, Bloomberg, Russell Associates, S&P Dow Jones, MSCI Inc., The St. Louis Federal Reserve and Y-Charts, Inc. The content is developed from sources believed to be providing accurate information. The information in this material is not intended as tax or legal advice. Please consult legal or tax professionals for specific information regarding your individual situation. The opinions expressed and material provided are for general information and should not be considered a solicitation for the purchase or sale of any security. Investing involves risks, including possible loss of principal. Please consider the investment objectives, risks, charges, and expenses of any security carefully before investing.
In order to provide effective management of your account, it is important that we have current information regarding your financial status and circumstances. Please contact us in writing at 303 Islington Street, Portsmouth, NH 03801 if you have any changes in your financial situation or investment objectives, and whether you wish to impose any reasonable restrictions on the management of the account or reasonably modify existing restrictions.
Measured Wealth Private Client Group, LLC is an investment adviser located in Portsmouth, New Hampshire. Measured Wealth Private Client Group, LLC is registered with the Securities and Exchange Commission (SEC). Registration of an investment adviser does not imply any specific level of skill or training and does not constitute an endorsement of the firm by the Commission. Measured Wealth Private Client Group, LLC only transacts business in states in which it is properly registered or is excluded or exempted from registration.
This publication is provided to clients and prospective clients of Measured Wealth Private Client Group, LLC for general informational and educational purposes only. It does not: (i) consider any person's individual needs, objectives, or circumstances; (ii) contain a recommendation, offer, or solicitation to buy or sell securities, or to enter into an agreement for investment advisory services; or (iii) constitute investment advice on which any person should or may rely. Past performance is no indication of future investment results. This publication is based on information obtained from third parties.
While Measured Wealth Private Client Group, LLC seeks information from sources it believes to be reliable, Measured Wealth Private Client Group, LLC has not verified, and cannot guarantee the accuracy, timeliness, or completeness, of the third-party information used in preparing this publication. The third-party information and this publication are provided on an “as is” basis without warranty.
This publication may contain forward-looking statements relating to the objectives, opportunities, and the future performance of the U.S. market generally. Forward-looking statements may be identified by the use of such words as; “should,” “estimated,” “potential” and other similar terms. Examples of forward-looking statements include, but are not limited to, estimates with respect to financial condition, results of operations, and success or lack of success of any particular investment strategy. All are subject to various factors, including, but not limited to general and local economic conditions, changing levels of competition within certain industries and markets, changes in interest rates, changes in legislation or regulation, and other economic, competitive, governmental, regulatory and technological factors affecting a portfolio's operations that could cause actual results to differ materially from projected results. Such statements are forward-looking in nature and involve a number of known and unknown risks, uncertainties and other factors, and accordingly, actual results may differ materially from those reflected or contemplated in such forward-looking statements. Prospective investors are cautioned not to place undue reliance on any forward-looking statements or examples. None of Measured Wealth Private Client Group, LLC or any of its affiliates or principals nor any other individual or entity assumes any obligation to update any forward-looking statements as a result of new information, subsequent events or any other circumstances. All statements made herein speak only as of the date that they were made.