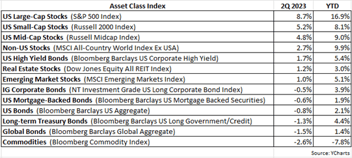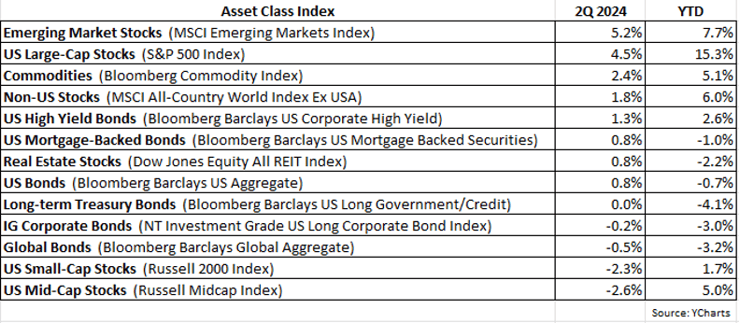
The second quarter of 2024 continued to see US large-cap stocks outdistance their smaller-cap brethren. The S&P 500 Index gained 4.5% in the quarter, whereas the Russell Midcap Index suffered a loss of -2.6% and the small-cap Russell 2000 Index also declined, losing -2.3%. For the year, the S&P 500 is up a robust 15.3%, compared to just a 5.0% gain for the Russell Midcap and a meager 1.7% increase for the Russell 2000. In short, the larger the market cap range, the better the performance. As further testament, the S&P 100 Index, which is comprised of US mega-caps, was up 7% in the 2Q and has returned 19% year-to-date (YTD).
As for fixed-income investments, returns were more or less breakeven in the quarter. High yield bonds were the best performer rising by 1.3%, and global bonds fared the worst with a -0.5% loss. Given these fairly flat returns, interest rates were, unsurprisingly, roughly unchanged in the quarter. But inflation has continued to subside, with the June CPI coming in at 3.0% versus the prior year, well off its peak of 9.1% set in mid-2022. There have been indications recently that the Fed could cut rates later this year, depending on the strength of the economy and the job market, in addition to inflation remaining tempered. However, the Fed tends to avoid policy actions before an election, not wanting to appear politically biased, so any rate cut would likely come after early November.
At the risk of sounding like a broken record, having discussed this topic in prior quarterly letters, the concentration of performance withing US cap-weighted indices (like the S&P 500) has gone from bad to worse. And unfortunately, such time periods of extremely narrow participation in price gains typically do not end well.
The following chart shows YTD performance of the S&P 500, while also showing the Index return excluding NVIDIA (NVDA), and the Index return excluding the “Magnificent 7” stocks.
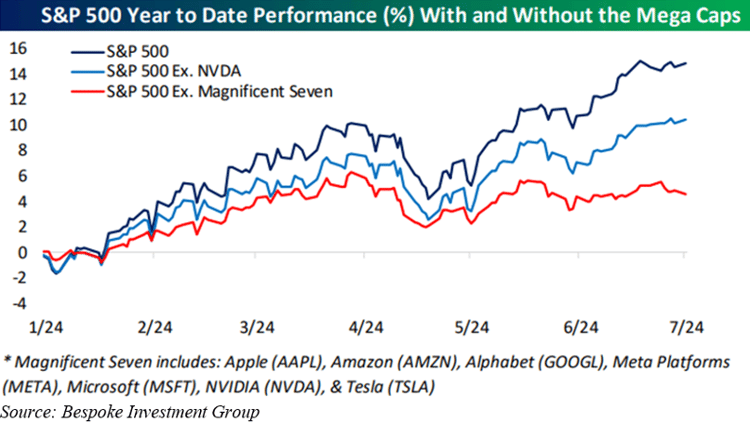
After removing NVIDIA, the YTD return for the S&P 500 drops from 15% to about 11%, and after removing the “Magnificent 7” stocks, the YTD return for the Index plummets to just about 4%. It’s astonishing to recognize that removing seven mega-cap stocks from the S&P 500 reduces gains by nearly ¾ or 75%!
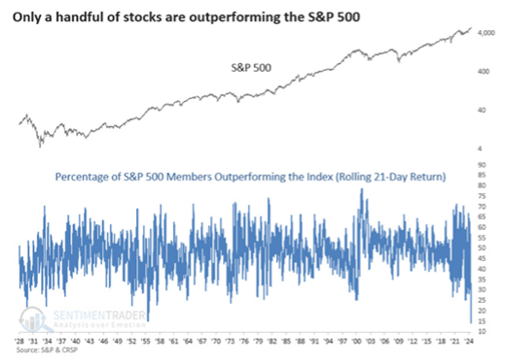
With so few stocks propelling the cap-weighted indices higher, is it any wonder that most member stocks are underperforming their respective indices? In fact, as the next chart displays, the percentage of S&P 500 member stocks outperforming the Index itself has reached the lowest level on record, dating as far back as 1928.
A final illustration of this point:
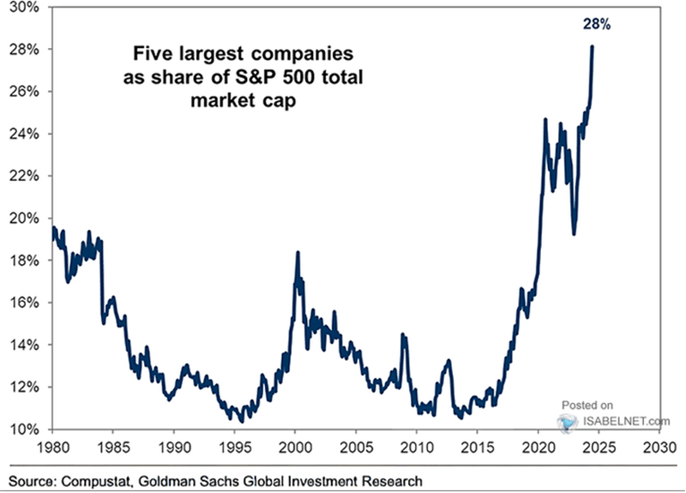
The chart above shows the percent share of the five largest companies in the S&P 500. Most recently, the five largest stocks in the Index comprise 28% of the entire S&P 500’s market cap, by far the highest level since 1980.
As already mentioned, periods like this do not generally end well, or at best inevitably lead to near-term consolidation of index performance as these few mega-cap leaders eventually underperform relative to the other smaller index members.
With respect to client portfolios, we remain defensively positioned as we are always being as mindful and vigilant about preserving capital as we are about striving to achieve significant relative gains.
As always, if you have any questions, please feel free to call or email. The entire team at Measured Wealth wishes to thank you for entrusting us to deliver on your financial goals.
Edward Miller, CFA, CMT
Chief Investment Officer
Measured Wealth Private Client Group
Important Disclosures
Historical data is not a guarantee that any of the events described will occur or that any strategy will be successful. Past performance is not indicative of future results.
Returns citied above are from various sources including Factset, Bloomberg, Russell Associates, S&P Dow Jones, MSCI Inc., The St. Louis Federal Reserve and Y-Charts, Inc. The content is developed from sources believed to be providing accurate information. The information in this material is not intended as tax or legal advice. Please consult legal or tax professionals for specific information regarding your individual situation. The opinions expressed and material provided are for general information and should not be considered a solicitation for the purchase or sale of any security. Investing involves risks, including possible loss of principal. Please consider the investment objectives, risks, charges, and expenses of any security carefully before investing.
In order to provide effective management of your account, it is important that we have current information regarding your financial status and circumstances. Please contact us in writing at 303 Islington Street, Portsmouth, NH 03801 if you have any changes in your financial situation or investment objectives, and whether you wish to impose any reasonable restrictions on the management of the account or reasonably modify existing restrictions.
Measured Wealth Private Client Group, LLC is an investment adviser located in Portsmouth, New Hampshire. Measured Wealth Private Client Group, LLC is registered with the Securities and Exchange Commission (SEC). Registration of an investment adviser does not imply any specific level of skill or training and does not constitute an endorsement of the firm by the Commission. Measured Wealth Private Client Group, LLC only transacts business in states in which it is properly registered or is excluded or exempted from registration.
This publication is provided to clients and prospective clients of Measured Wealth Private Client Group, LLC for general informational and educational purposes only. It does not: (i) consider any person's individual needs, objectives, or circumstances; (ii) contain a recommendation, offer, or solicitation to buy or sell securities, or to enter into an agreement for investment advisory services; or (iii) constitute investment advice on which any person should or may rely. Past performance is no indication of future investment results. This publication is based on information obtained from third parties. While Measured Wealth Private Client Group, LLC seeks information from sources it believes to be reliable, Measured Wealth Private Client Group, LLC has not verified, and cannot guarantee the accuracy, timeliness, or completeness, of the third-party information used in preparing this publication. The third-party information and this publication are provided on an “as is” basis without warranty.
This publication may contain forward-looking statements relating to the objectives, opportunities, and the future performance of the U.S. market generally. Forward-looking statements may be identified by the use of such words as; “should,” “estimated,” “potential” and other similar terms. Examples of forward-looking statements include, but are not limited to, estimates with respect to financial condition, results of operations, and success or lack of success of any particular investment strategy. All are subject to various factors, including, but not limited to general and local economic conditions, changing levels of competition within certain industries and markets, changes in interest rates, changes in legislation or regulation, and other economic, competitive, governmental, regulatory and technological factors affecting a portfolio's operations that could cause actual results to differ materially from projected results. Such statements are forward-looking in nature and involve a number of known and unknown risks, uncertainties and other factors, and accordingly, actual results may differ materially from those reflected or contemplated in such forward-looking statements. Prospective investors are cautioned not to place undue reliance on any forward-looking statements or examples. None of Measured Wealth Private Client Group, LLC or any of its affiliates or principals nor any other individual or entity assumes any obligation to update any forward-looking statements as a result of new information, subsequent events or any other circumstances. All statements made herein speak only as of the date that they were made.