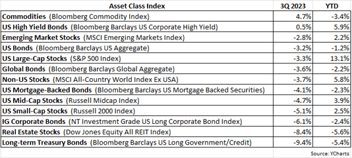
After rising relatively uninterrupted since last November, US equities took an overdue breather in the third quarter. As shown in the table below, the S&P 500 was up a meager 0.6% in the quarter, with the Russell Midcap Index falling by 0.9% and the small-cap Russell 2000 Index faring worse with a negative 4.4% return. Commodities continued to do well this year, gaining 6.6% in the quarter, adding to its stellar year-to-date (YTD) return of 29.1% (as per the Bloomberg Commodity Index). In fact, the best performing asset classes YTD have been those that historically benefit from an inflationary environment, namely equities, real estate (REITs) and commodities. However, non-US equities remain laggards, in large part due to the buoyant US dollar and brewing concerns about China’s economic growth.
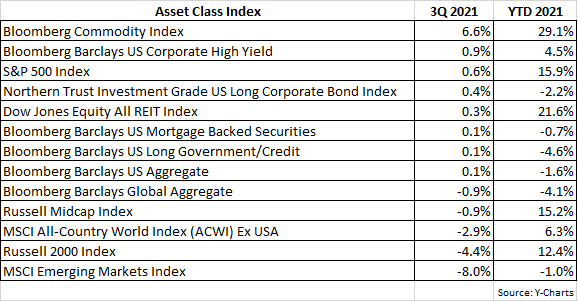
As with equities, fixed-income securities also experienced a fairly disappointing quarter. The Barclays US Aggregate Bond Index was basically flat for the quarter, unable to attain any traction since Treasury yields declined in the first half of the third quarter only to then rise in the second half. International bonds did not fare well in the quarter, with the Barclays Global Aggregate Bond Index declining by 0.9%.
Despite the pause in equity markets, the economic recovery remains strong. Cases of COVID appear to have peaked in both the US and globally, and currently 66% of the US population has received at least one vaccine dose and 57% have been fully vaccinated. Whereas earlier this year the spread of the Delta variant had investors worried that we may be headed for a significant setback in the economy’s recovery, such fears have abated considerably.
In September, after much anticipation by investors, the Fed indicated it would begin a gradual tapering process, slowing the pace of its bond purchases that has worked to keep interest rates low during the pandemic. If signs of escalating inflation do not eventually dissipate, it increases the likelihood that the Fed will raise interest rates, most likely next year.
However, it’s worth noting that, in our opinion, it has become the consensus view that inflation will remain a problem and in response the Fed will hike interest rates. But when it comes to investing, the consensus view is all too often wrong. Robert Farrell, a Wall Street legend who for decades was the chief market strategist for Merrill Lynch, maintained 10 rules for investing, one being: “When all the experts and forecasts agree – something else is going to happen.” In general, when something becomes a very commonly-held view, as if it’s almost a foregone conclusion that it will happen, then it very likely won’t happen. Investor sentiment is typically a contrary indicator. As an example, late last year it seemingly became the consensus view that the US dollar would weaken and decline, and yet this year the dollar has steadily appreciated. The point being it often pays to at least question and attempt to poke holes in outlooks deemed to be universally accepted.
Assuming that indeed the consensus view is the Fed will eventually raise rates to combat inflation, what could possibly occur to prove this expectation incorrect? For one, inflation could be alleviated if economic growth were to slow from what has been an extraordinarily rapid pace. With no more COVID-related government fiscal aid in the cards, and the Fed signaling its asset repurchasing activity (QE) will begin to wind down, much of the collective stimulus that has been fueling economic growth will gradually run out. Mind you, we’re not suggesting such tempering of stimulus will result in a recession, but rather that the economy simply moderates from what was an unsustainably high growth rate.
The following chart illustrates the close relationship between economic activity and prices (inflation):
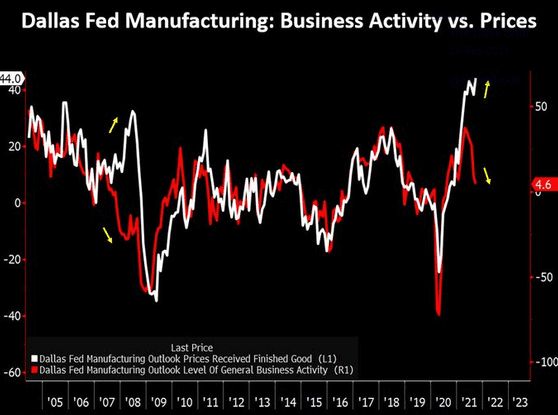
The Fed Reserve Bank of Dallas conducts monthly surveys to obtain assessments of business activity and pricing in Texas. The red line in the chart measures business activity and the white line reflects pricing on goods. The two lines are clearly correlated with declining or slowing business activity resulting in lower prices and vice versa, as business activity heats up or rises so also does pricing pressure (inflation). As it happens, recently the red line in the chart has been declining, indicating business activity is dropping, which should lead to the white line (pricing) eventually receding – similar to what occurred in 2007-2008 when the red line diverged from the white line (see yellow arrows).
Another possible remedy for the rise in inflation is a resolution of the many supply chain bottlenecks that have existed since the onset of the pandemic. The significant increase in consumer demand during the recovery combined with supply shortages due to COVID-related disruptions has greatly contributed to the escalation in prices. But supply chain bottlenecks won’t last forever, eventually easing and returning to some semblance of normalcy, which in turn should serve to diminish pricing pressures.
A key concern for investors is if inflation continues to heat up and the Fed finds itself behind the curve, that it will then be forced to abruptly start raising interest rates to lower inflation, perhaps leading to both escalating inflation and interest rates – an environment usually not accommodating for financial markets. The real fear is the Fed could eventually overshoot the raising of rates in its effort to steer off inflation and thus adversely affect economic growth.
It’s for this reason that investors keep close watch on the 10-year Treasury yield as it tends to give timely clues about what the Fed may do with interest rates in the near future. A persistent, rising 10-year Treasury yield often infers that investors believe inflation could become a potential problem and the Fed will, in due time, raise interest rates. In our 2Q missive, we showed the following chart which helps us in assessing and anticipating interest rate direction.
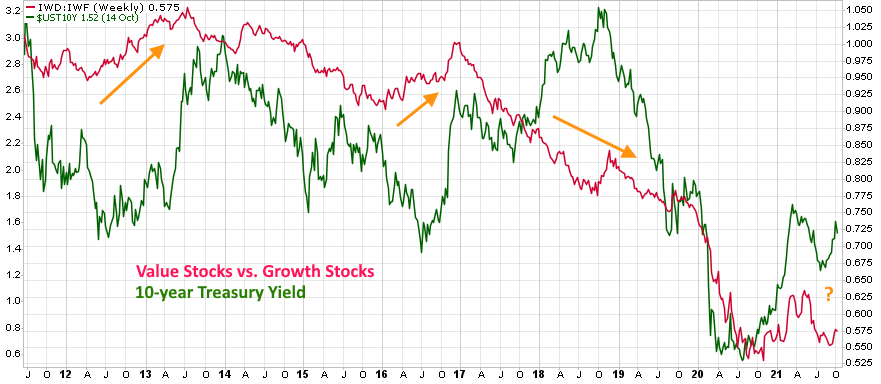
The red line in the chart represents the relative return of the Russell 1000 Value Index vs. the Russell 1000 Growth Index, and the green line is the 10-year Treasury yield. When the red line is rising or in an uptrend, meaning value stocks are outperforming growth stocks, the 10-year Treasury yield usually follows suit, rising as well. Notice in years 2012 and 2016, the red line was rising (as denoted by orange arrows) and the 10-year yield eventually spiked higher. In 2018, the red line was declining, as value stocks were underperforming growth stocks, and the 10-year Treasury yield stopped rising and declined over the next two years. For 2021, the 10-year yield has spiked higher and remains somewhat elevated, and yet notice the red line is languishing and not rising to confirm the rise in the 10-year Treasury yield. Until value stocks outperform growth stocks on a longer-term basis, breaking the multi-year downtrend for the red line, it remains to be seen if interest rates will head higher, along with inflation (what the consensus expects).
Bottom line: we’re always questioning consensus views and exploring alternative scenarios or potential contrarian outcomes. As the ever-quotable Yogi Berra once said, “It's tough to make predictions, especially about the future.” But in our experience, forecasting can be greatly improved by avoiding the knee-jerk reaction to simply go along with whatever is being repeated in the financial media. More often than not, the crowd is incorrect and something else happens.
The team at Measured Wealth wishes you all the best during the rest of 2021. As always, if you have any questions, feel free to call or email.
Ed Miller, CFA, CMT
Chief Investment Officer
Measured Wealth Private Client Group
Important Disclosures
Historical data is not a guarantee that any of the events described will occur or that any strategy will be successful. Past performance is not indicative of future results.
Returns citied above are from various sources including Factset, Bloomberg, Russell Associates, S&P Dow Jones, MSCI Inc., The St. Louis Federal Reserve and Y-Charts, Inc. The content is developed from sources believed to be providing accurate information. The information in this material is not intended as tax or legal advice. Please consult legal or tax professionals for specific information regarding your individual situation. The opinions expressed and material provided are for general information and should not be considered a solicitation for the purchase or sale of any security. Investing involves risks, including possible loss of principal. Please consider the investment objectives, risks, charges, and expenses of any security carefully before investing.
In order to provide effective management of your account, it is important that we have current information regarding your financial status and circumstances. Please contact us in writing at 303 Islington Street, Portsmouth, NH 03801 if you have any changes in your financial situation or investment objectives, and whether you wish to impose any reasonable restrictions on the management of the account or reasonably modify existing restrictions.
Measured Wealth Private Client Group, LLC is an investment adviser located in Portsmouth, New Hampshire. Measured Wealth Private Client Group, LLC is registered with the Securities and Exchange Commission (SEC). Registration of an investment adviser does not imply any specific level of skill or training and does not constitute an endorsement of the firm by the Commission. Measured Wealth Private Client Group, LLC only transacts business in states in which it is properly registered or is excluded or exempted from registration.
This publication is provided to clients and prospective clients of Measured Wealth Private Client Group, LLC for general informational and educational purposes only. It does not: (i) consider any person's individual needs, objectives, or circumstances; (ii) contain a recommendation, offer, or solicitation to buy or sell securities, or to enter into an agreement for investment advisory services; or (iii) constitute investment advice on which any person should or may rely. Past performance is no indication of future investment results. This publication is based on information obtained from third parties.
While Measured Wealth Private Client Group, LLC seeks information from sources it believes to be reliable, Measured Wealth Private Client Group, LLC has not verified, and cannot guarantee the accuracy, timeliness, or completeness, of the third-party information used in preparing this publication. The third-party information and this publication are provided on an “as is” basis without warranty.
This publication may contain forward-looking statements relating to the objectives, opportunities, and the future performance of the U.S. market generally. Forward-looking statements may be identified by the use of such words as; “should,” “estimated,” “potential” and other similar terms. Examples of forward-looking statements include, but are not limited to, estimates with respect to financial condition, results of operations, and success or lack of success of any particular investment strategy. All are subject to various factors, including, but not limited to general and local economic conditions, changing levels of competition within certain industries and markets, changes in interest rates, changes in legislation or regulation, and other economic, competitive, governmental, regulatory and technological factors affecting a portfolio's operations that could cause actual results to differ materially from projected results. Such statements are forward-looking in nature and involve a number of known and unknown risks, uncertainties and other factors, and accordingly, actual results may differ materially from those reflected or contemplated in such forward-looking statements. Prospective investors are cautioned not to place undue reliance on any forward-looking statements or examples. None of Measured Wealth Private Client Group, LLC or any of its affiliates or principals nor any other individual or entity assumes any obligation to update any forward-looking statements as a result of new information, subsequent events or any other circumstances. All statements made herein speak only as of the date that they were made.