By Edward Miller, CFA®, CMT®
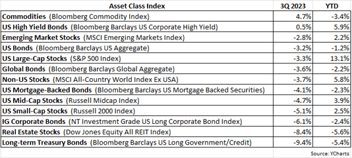
Through the 3Q, the pain continued for most markets. And when referring to “most markets,” this includes both equity and fixed-income markets – quite a rare occurrence. In the 1Q and 2Q of this year, both the S&P 500 and the Barclays US Aggregate Bond Index experienced negative returns, and that trend continued in the 3Q as the S&P 500 declined by -4.9% and the Barclays US Aggregate fell by -4.8%. It’s worth noting that three consecutive and concurrent quarters of declines for both of these indices has never occurred, dating back to 1976, the inception of the Barclays Aggregate Bond Index.
As inflation has remained stubbornly high, with the Fed responding by continuing to aggressively raise interest rates, bond prices have taken it on the chin, hard. But in this environment of monetary policy tightening and reduced liquidity, equites have also headed south as investors grapple with the possibility of entering a Fed-induced economic recession. It’s no wonder that apart from commodities, there are very few places for investors to hide.
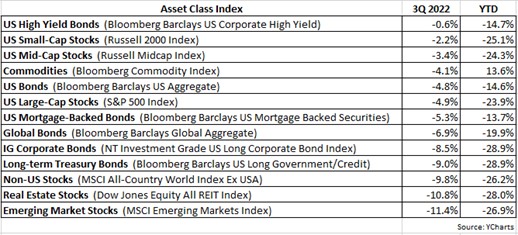
As shown in the table above, year-to-date (YTD), most major equity indices remain in bear market territory (defined -20% or more from its peak). Making matters worse, the Barclays US Aggregate Bond Index is down by nearly -15% this year, having by far its worse year since its inception, with previously the worst year being -2.9% in 1994.
Fortunately, our portfolio positioning has been defensive since late last year and remains so through the 3Q. At this point, a common question we hear from clients is, “When will things turnaround and what will it take for that to happen?” As written in past quarterly letters, we have contended that as long as inflation remains elevated and the Fed maintains its very hawkish stance, both equity and fixed-income markets would remain weak. But once there were meaningful signs of inflation peaking and even subsiding, inferring the Fed would no longer be under pressure to raise rates and in fact could pivot to a more dovish view, then we would expect investors to become less fearful and prone to selling.
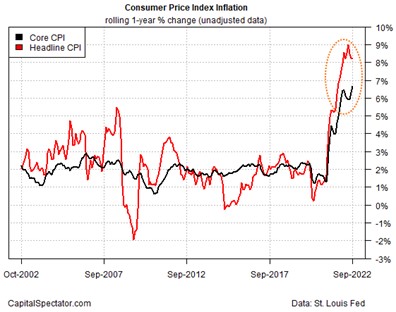
That said, there are some initial indications that both inflation and interest rates could be peaking. The following chart shows the headline and core CPIs or inflation rates. The difference between the two is the headline CPI includes gas & food prices, whereas the core CPI excludes them. Food and energy prices tend to be very volatile and can distort the true underlying trend of inflation. It’s for this reason the Fed prefers tracking the more stable core CPI when setting policy. Also, notice in the chart that when the headline CPI greatly deviates away from the core CPI, it typically reverts back to the core CPI.
Currently, the headline CPI is significantly above the core CPI, and both inflation rates appear to be in the process of rolling over.
The next chart shows the 10-year Treasury yield going back to 1998 along with a momentum indicator (stochastic) in the lower inset.
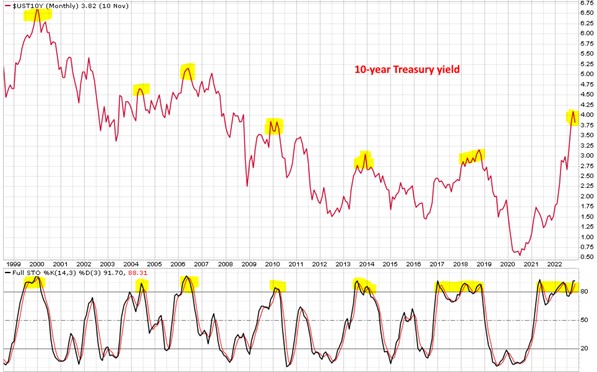
As depicted in the monthly chart, the yellow shaded areas identify periods when the 10-year Treasury yield was “overbought” or significantly extended to the upside. Notice during these times in the past that the 10-year yield didn’t have much farther to go higher and instead typically peaked and reverted, heading down for the next several months or years. With inflation possibly topping and the 10-year yield extended and perhaps readying to turn lower, we could be observing trend changes that eventually allow the Fed to reconsider future rate hikes.
While signs of inflation abating are bullish for markets, we are concerned that perhaps the Fed has already overshot with interest rate hikes, making a recession highly probable in the near future. It’s once again worth repeating what we wrote in the 1Q 2022 investment letter:
An outcome of the Fed raising rates is the economy tends to slow down and even risks entering a recession. The proverbial “soft landing” for the economy is always the Fed’s goal but is almost never achieved. Instead, the Fed is typically “behind the curve” with inflation, meaning it’s arguably late in starting rate hikes and as a result goes too far with the number of rate increases, draining precious liquidity from the financial system and eventually pushing the economy into recession.
The following chart reflects this tendency by the Fed to overshoot with interest rate hikes, eventually having success in breaking the rise of inflation, but at the cost of pushing the economy into a recession.
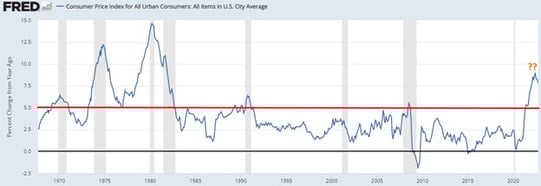
The chart above shows the yearly change in inflation (CPI) since 1968. When the inflation rate gets above 5% (red line), an eventual final peak in inflation has occurred during recessions (within the grey shaded areas). When annual inflation rises to a level beyond 5%, it conceivably becomes more difficult to combat and tame, requiring the Fed to become quite aggressive with rate hikes. Yet inevitably the Fed’s actions break both inflation and the economy.
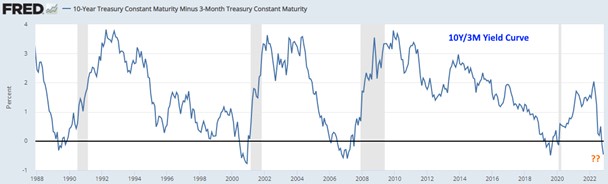
Another troubling omen of a future recession is coming from the Treasury yield curve. As we have discussed in past letters, the yield curve has one of the best long-term track records for predicting recessions. When the 10-year Treasury yield falls below the 3-month Treasury yield, the yield curve becomes inverted, a condition that has preceded the last eight US recessions. The following chart shows the 10Y/3M yield curve since 1988 with recessions shaded grey. In the chart, when the blue line descends below the black horizontal line, the yield curve is inverted – as it is currently.
Past performance does not guarantee future results, meaning we may actually avoid entering a recession over the next several months. However, admittedly it’s difficult to argue with an 8-0 record!
Despite these foreboding indications for the economy, there are some bullish points to keep in mind. For one, the current 3.7% unemployment rate – which typically tends to rise before a recession – remains at historic lows. Also, consumer spending, which accounts for nearly 70% of US economic activity, has remained relatively robust so far this year. As for the stock market, historically the worst seasonal period for equities is from May through mid-October, with the 4Q being the best 3-month period for performance. Hopefully this seasonal tailwind will help to counteract or negate any emerging bearish developments over the next few months.
As always, if you have any questions, please feel free to call or email. The entire team at Measured Wealth wishes you all the best during this upcoming holiday season.

Ed Miller, CFA, CMT
Chief Investment Officer
Measured Wealth Private Client Group
Important Disclosures
Historical data is not a guarantee that any of the events described will occur or that any strategy will be successful. Past performance is not indicative of future results.
Returns citied above are from various sources including Factset, Bloomberg, Russell Associates, S&P Dow Jones, MSCI Inc., The St. Louis Federal Reserve and Y-Charts, Inc. The content is developed from sources believed to be providing accurate information. The information in this material is not intended as tax or legal advice. Please consult legal or tax professionals for specific information regarding your individual situation. The opinions expressed and material provided are for general information and should not be considered a solicitation for the purchase or sale of any security. Investing involves risks, including possible loss of principal. Please consider the investment objectives, risks, charges, and expenses of any security carefully before investing.
In order to provide effective management of your account, it is important that we have current information regarding your financial status and circumstances. Please contact us in writing at 303 Islington Street, Portsmouth, NH 03801 if you have any changes in your financial situation or investment objectives, and whether you wish to impose any reasonable restrictions on the management of the account or reasonably modify existing restrictions.
Measured Wealth Private Client Group, LLC is an investment adviser located in Portsmouth, New Hampshire. Measured Wealth Private Client Group, LLC is registered with the Securities and Exchange Commission (SEC). Registration of an investment adviser does not imply any specific level of skill or training and does not constitute an endorsement of the firm by the Commission. Measured Wealth Private Client Group, LLC only transacts business in states in which it is properly registered or is excluded or exempted from registration.
This publication is provided to clients and prospective clients of Measured Wealth Private Client Group, LLC for general informational and educational purposes only. It does not: (i) consider any person's individual needs, objectives, or circumstances; (ii) contain a recommendation, offer, or solicitation to buy or sell securities, or to enter into an agreement for investment advisory services; or (iii) constitute investment advice on which any person should or may rely. Past performance is no indication of future investment results. This publication is based on information obtained from third parties. While Measured Wealth Private Client Group, LLC seeks information from sources it believes to be reliable, Measured Wealth Private Client Group, LLC has not verified, and cannot guarantee the accuracy, timeliness, or completeness, of the third-party information used in preparing this publication. The third-party information and this publication are provided on an “as is” basis without warranty.
This publication may contain forward-looking statements relating to the objectives, opportunities, and the future performance of the U.S. market generally. Forward-looking statements may be identified by the use of such words as; “should,” “estimated,” “potential” and other similar terms. Examples of forward-looking statements include, but are not limited to, estimates with respect to financial condition, results of operations, and success or lack of success of any particular investment strategy. All are subject to various factors, including, but not limited to general and local economic conditions, changing levels of competition within certain industries and markets, changes in interest rates, changes in legislation or regulation, and other economic, competitive, governmental, regulatory and technological factors affecting a portfolio's operations that could cause actual results to differ materially from projected results. Such statements are forward-looking in nature and involve a number of known and unknown risks, uncertainties and other factors, and accordingly, actual results may differ materially from those reflected or contemplated in such forward-looking statements. Prospective investors are cautioned not to place undue reliance on any forward-looking statements or examples. None of Measured Wealth Private Client Group, LLC or any of its affiliates or principals nor any other individual or entity assumes any obligation to update any forward-looking statements as a result of new information, subsequent events or any other circumstances. All statements made herein speak only as of the date that they were made.