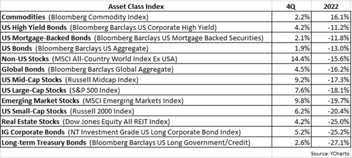
Despite the continuing pandemic, 2021 was terrific for US equities as the S&P 500 rose 11% in the 4Q and finished the year up 28.7%. It wasn’t just large-caps that did well as the Russell Midcap Index gained 22.6% and the small-cap Russell 2000 Index closed out the year with a very respectable 14.8% return.
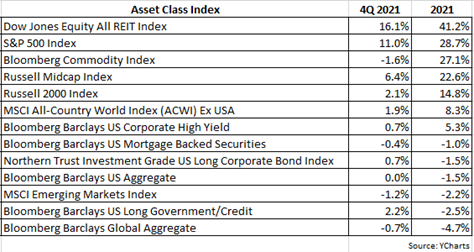
Given the fact that inflaction had been a growing conern for most of 2021, it’s not surprising to see REITs and commodities – two asset classes that tend to perform very well in inflationary environments – at the top of the list of best performers last year, returning 41.2% and 27.1% respectively. Although US equities have achieved a rare occurrence, three consecutive years of double-digit returns, non-US stocks remain laggards, with the MSCI All-Country World ex-USA Index garnering a modest 8.3% return in 2021 and the MSCI Emerging Markets Index posting a -2.2% decline for the year.
In stark contrast to most equity markets, fixed-income securities experienced a fairly disappointing 2021. The bellwether Barclays US Aggregate Bond Index was down -1.5% for the year, marking just the fourth negative annual return since its inception in 1970. International bonds fared even worse as the Barclays Global Aggregate Bond Index declined by nearly 5%. US high yield bonds were the relative winner gaining 5.3% for the year, which makes sense since they’re highly correlated with US equities.
Turning our attention to 2022, with the advent of a new year, we can expect to see the usual deluge of market outlooks and annual forecasts from Wall Street strategists. And at this time I always recall more than one such strategist privately confessing that they hated putting together these outlooks, admitting it was more or less educated guesswork trying to predict what would happen during the year, but that they were pressured to do so because clients expected it. In fact, a good argument can be made that it’s easier to predict what will happen either next week or in ten years than it is to forecast what will occur in the next twelve months.
That said we will venture to make three “educated guesses” about 2022: 1) market volatility will increase, 2) economic growth will slowdown, and 3) inflation will recede. As for volatility, since 1928, corrections of at least 10% have occurred in the S&P 500 on average 1.1 times per year. Through 2021,
the last time the S&P 500 suffered a drawdown of at least 10% was in June 2020, or about 18 months ago, so a meaningful correction is overdue.
It’s worth reminding that at any point in time, we can always put together a list of several things to worry about when it comes to investing in the stock market. If we always allowed any of these things to overly concern us, we’d always be 100% in cash. In fact, there’s much truth to the sayings, “bull markets climb a wall of worry” and “bear markets slide down a slope of hope.” More often than not, the time to really worry about a bear market developing is when there’s no perceived signs of a bear market occurring. During such time, investors are usually very optimistic and hopeful about the future, arguably too much so, as they tend to quickly dismiss any arising bad news as no big deal. Complacency sets in and any market decline is seen as a time to blindly step-in and “buy the dip.” A textbook example of this environment was during the tech-bubble of 2000, when the internet was expected to revolutionize everything and equity valuations were all but ignored.
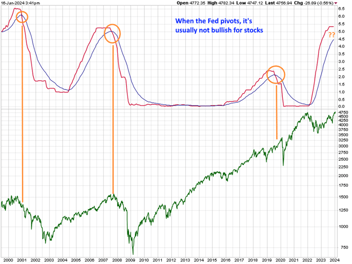
Granted, the last 18+ months have been extremely bullish for US equities and perhaps investors had become too comfortable with the idea that the Fed
will always save us. The Fed’s ballooning balance sheet and maintaining low interest rates, along with the federal government’s COVID-related fiscal stimulus, provided an unprecedented massive injection of liquidity which propelled markets higher. But all of that is now past history as the Fed is facing
a reversal in its easing stance to combat stubborn inflation and any aid from the government is drying up. With the prospect of tighter monetary policy this year, investors will be re-calibrating valuations, which for many sectors had become quite bloated.
As mentioned, the massive stimulus coming from both the Fed and the federal government – fueling record-setting growth rates since the start of the pandemic – will be winding down this year. The shrinkage or tightening of such unprecedented liquidity will likely result in the slowing of the economy.
This expectation does not necessarily mean a recession will occur; in fact, leading economic indicators currently show no evidence of a recession on the horizon. However, it stands to reason that lacking exorbitant fiscal and monetary stimulus, economic growth should moderate and return to levels of normalcy.
Assuming that the economy does indeed slow or decelerate, it should serve as a tailwind to help alleviate inflation. Typically a primary reason for rising prices is strong demand for goods and services as a result of a rapidly growing economy. In our current situation, along with extraordinarily high consumer demand, the catalyst for inflation has been further compounded by widespread supply-chain bottlenecks. However, such bottlenecks won’t last forever, and there’s already indications that supply-chain disruptions are easing which should translate into diminished inflation.
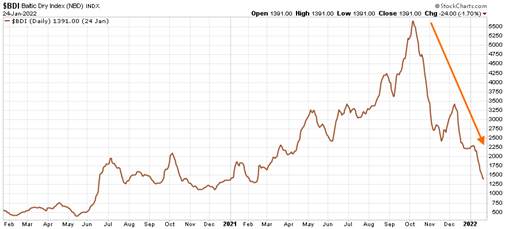
The chart above shows the Baltic Dry Index (BDI), which tracks the cost of shipping commodities and raw materials. As the duration of the pandemic extended, leading to an increase in bottlenecks, shipping costs increased as reflected by the BDI rising by nearly 800% from May 2020 to its peak in October of last year. But since then the BDI has plummeted by more than 60%, inferring the supply-chain crisis could be abating and normalizing.
Another hopeful sign of inflation dissipating in the near future is shown in the chart below:
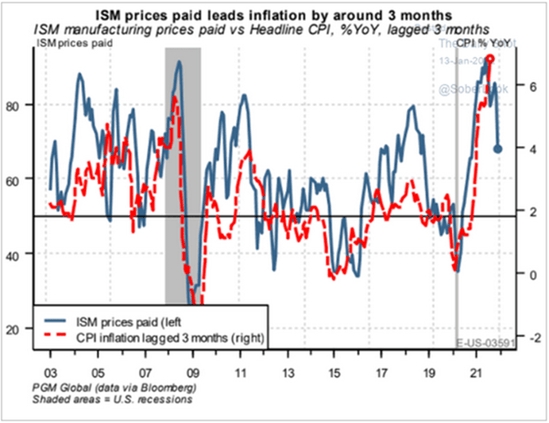
The ISM prices paid index (blue line) measures how much manufacturers are paying their suppliers and it tends to lead inflation (CPI, red line) by about three months. Note that the blue line peaked last year and since then has been heading south, suggesting inflation should likewise recede over the next several months.
Finally, although we do expect market volatility to pick up this year, the following exhibit serves as a sobering reminder that corrections, while painful, are not out of the norm and should not be a cause for panic. Since 1980, the average correction for the S&P 500 has been approximately -19% and 1-year later the index has gained on average about +25% from the lows 90% of the time, and after two years has risen by +37% off the lows about 87% of the time.
The team at Measured Wealth wishes you all the best during the rest of 2021. As always, if you have any questions, feel free to call or email.

Ed Miller, CFA, CMT
Chief Investment Officer
Measured Wealth Private Client Group
Important Disclosures
Historical data is not a guarantee that any of the events described will occur or that any strategy will be successful. Past performance is not indicative of future results.
Returns citied above are from various sources including Factset, Bloomberg, Russell Associates, S&P Dow Jones, MSCI Inc., The St. Louis Federal Reserve and Y-Charts, Inc. The content is developed from sources believed to be providing accurate information. The information in this material is not intended as tax or legal advice. Please consult legal or tax professionals for specific information regarding your individual situation. The opinions expressed and material provided are for general information and should not be considered a solicitation for the purchase or sale of any security. Investing involves risks, including possible loss of principal. Please consider the investment objectives, risks, charges, and expenses of any security carefully before investing.
In order to provide effective management of your account, it is important that we have current information regarding your financial status and circumstances. Please contact us in writing at 303 Islington Street, Portsmouth, NH 03801 if you have any changes in your financial situation or investment objectives, and whether you wish to impose any reasonable restrictions on the management of the account or reasonably modify existing restrictions.
Measured Wealth Private Client Group, LLC is an investment adviser located in Portsmouth, New Hampshire. Measured Wealth Private Client Group, LLC is registered with the Securities and Exchange Commission (SEC). Registration of an investment adviser does not imply any specific level of skill or training and does not constitute an endorsement of the firm by the Commission. Measured Wealth Private Client Group, LLC only transacts business in states in which it is properly registered or is excluded or exempted from registration.
This publication is provided to clients and prospective clients of Measured Wealth Private Client Group, LLC for general informational and educational purposes only. It does not: (i) consider any person's individual needs, objectives, or circumstances; (ii) contain a recommendation, offer, or solicitation to buy or sell securities, or to enter into an agreement for investment advisory services; or (iii) constitute investment advice on which any person should or may rely. Past performance is no indication of future investment results. This publication is based on information obtained from third parties.
While Measured Wealth Private Client Group, LLC seeks information from sources it believes to be reliable, Measured Wealth Private Client Group, LLC has not verified, and cannot guarantee the accuracy, timeliness, or completeness, of the third-party information used in preparing this publication. The third-party information and this publication are provided on an “as is” basis without warranty.
This publication may contain forward-looking statements relating to the objectives, opportunities, and the future performance of the U.S. market generally. Forward-looking statements may be identified by the use of such words as; “should,” “estimated,” “potential” and other similar terms. Examples of forward-looking statements include, but are not limited to, estimates with respect to financial condition, results of operations, and success or lack of success of any particular investment strategy. All are subject to various factors, including, but not limited to general and local economic conditions, changing levels of competition within certain industries and markets, changes in interest rates, changes in legislation or regulation, and other economic, competitive, governmental, regulatory and technological factors affecting a portfolio's operations that could cause actual results to differ materially from projected results. Such statements are forward-looking in nature and involve a number of known and unknown risks, uncertainties and other factors, and accordingly, actual results may differ materially from those reflected or contemplated in such forward-looking statements. Prospective investors are cautioned not to place undue reliance on any forward-looking statements or examples. None of Measured Wealth Private Client Group, LLC or any of its affiliates or principals nor any other individual or entity assumes any obligation to update any forward-looking statements as a result of new information, subsequent events or any other circumstances. All statements made herein speak only as of the date that they were made.