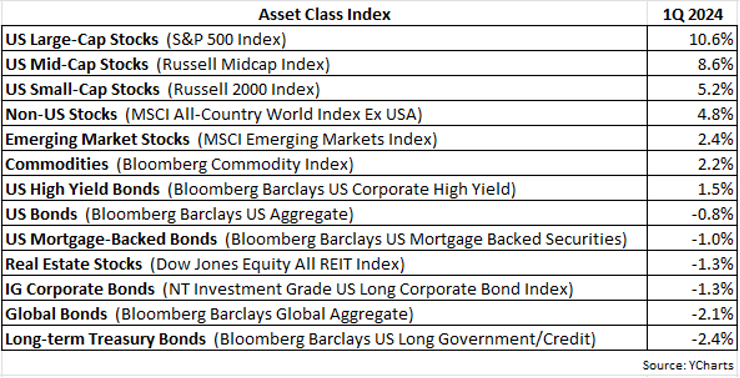
The first quarter of 2024 was a positive one for most equities and a negative one for most fixed-income investments. Stocks continued to rise despite the ongoing threats of a recession, inflation and geopolitical risks. It seemingly confirmed the old saying, “rising markets climb a wall of worry.”
Bonds, however, tended to suffer flat-to-negative returns in the 1Q due primarily to the Fed signaling that there will likely be no interest rate cuts this year. This stance by the Fed is quite a stark reversal from the start of 2024 when investors were expecting somewhere between 4-6 rate cuts this year. Despite the fact that inflation has been trending downward since mid-2022, the Fed remains very cautious about prematurely cutting rates, fearing that the relatively strong economy could reverse this moderating trend in prices.
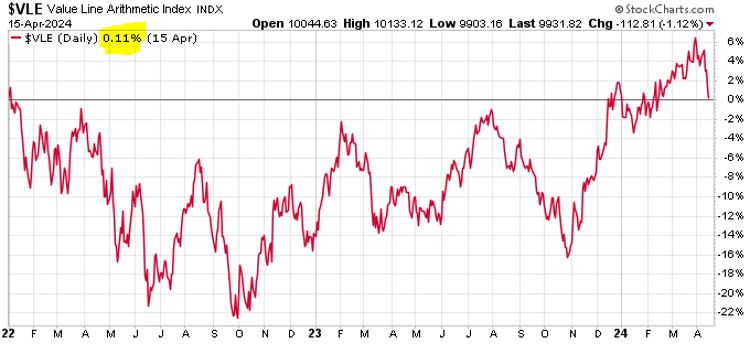
Whereas in 2023 the “Magnificent 7” stocks soared much higher than the S&P 500 Index, rising by 112% on average, so far this year their returns have been more tepid. Nvidia, Meta (Facebook), Amazon and Microsoft outperformed the S&P 500 in the 1Q, but Google, Apple and Tesla underperformed, with the latter two names experiencing negative returns (AAPL -11% and TSLA -29%). The performance of the S&P 500 remains concentrated in the mega-caps as the equal-weight S&P 500 returned just 7.7% in the 1Q compared to a 10.6% return for the cap-weighted S&P 500. In fact, the average US stock is nearly flat since the start of 2022, as represented by the Value Line Arithmetic Index:
To further illustrate the extreme top-heaviness within the US stock market, the following chart dates back to 1926 and shows the market cap concentration of the top 10% largest stocks.
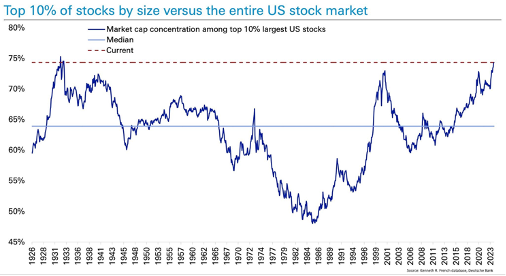
The top 10% largest companies comprise approximately 74% of the entire US stock market capitalization, a level not reached since 1929.
What will be the best performing asset class over the next 5-10 years?
Great question! Given that we don’t have a crystal ball, I can’t readily answer that question. However, based on statistics and historical evidence, we can credibly surmise which asset class will likely not be the big winner over the next 5-10 years.
First, let’s review how the major asset classes have performed over the last 10 years. The following table lists the 10-year annualized returns of asset classes, sorted best to worst.
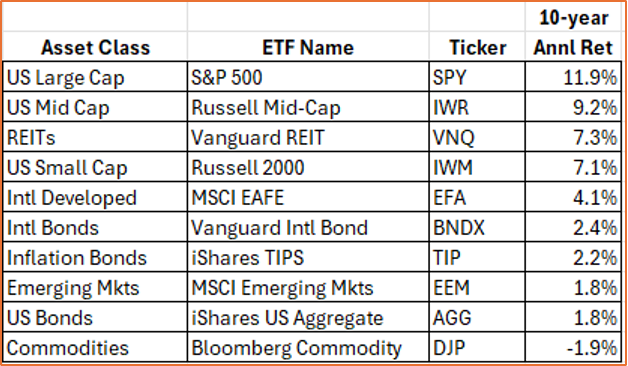
US large-cap stocks (S&P 500) were the best performing asset class from 2013-2023, with US mid-caps, US REITs and US small-caps next in line, respectively. In short, US equites have been the big winner over the last 10 years.
While that’s obviously wonderful news for investors who during this time period were overweight US stocks, and particularly large-cap US stocks, at some point performance leaders tend to hit a ceiling and then recede. As this next chart illustrates, the rolling 10-year return for the S&P 500 has experienced a ceiling of approximately +250% before finally peaking and reverting lower.
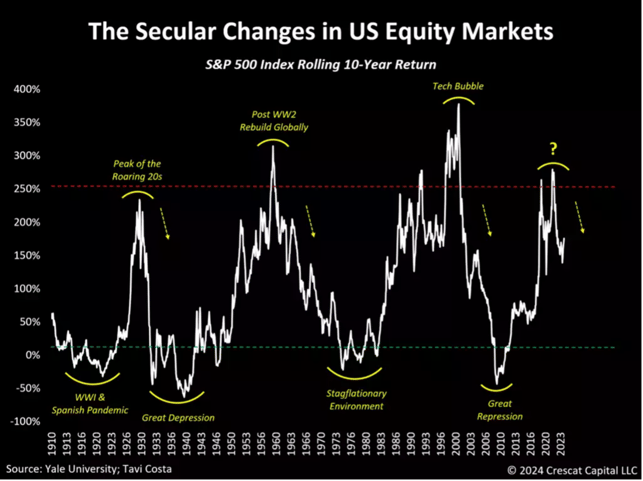
It appears that the 10-year return for the S&P 500 may have attained that upper threshold recently, which if true could see a retrenchment in performance over the next several years.
When it comes to identifying what potentially will or will not outperform in the future, valuation metrics are especially effective. An asset class or investment vehicle that is deemed extremely overvalued implies that all positive expectations for future growth are front-loaded into the present, which leaves very little room for disappointment. And almost without fail, the asset class or investment vehicle does at some point disappoint, likely more than once.
My preferred valuation metric for this exercise is the Shiller P/E, also known as the CAPE ratio, which stands for cyclically adjusted P/E. Nobel-winning economist Robert Shiller popularized this version of the P/E ratio, which uses a 10-year average of inflation-adjusted earnings instead of a single year of earnings. By lengthening the time period of earnings, it smooths out the peaks and valleys of earnings, making the resulting P/E ratio more stable and less susceptible to fluctuations in the business cycle.
The chart below shows a scatter plot of the S&P 500’s CAPE ratio (horizontal axis) and the forward 10-year annualized return for the S&P 500 (vertical axis).
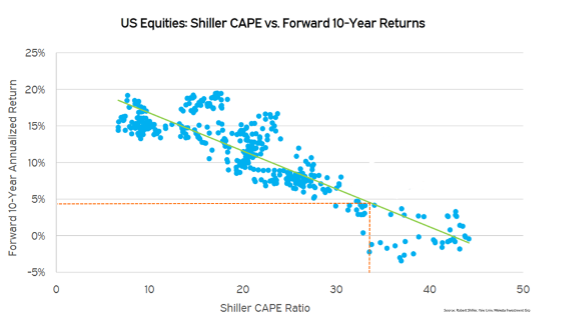
As depicted by the green regression line, the higher the CAPE, or the more overvalued the asset class or investment vehicle, the lower the forward or future 10-year return. As an example, a CAPE ratio of 10x translates into a forward 10-year annualized return of approximately 18% for the S&P 500.
Unfortunately, the current CAPE ratio for the S&P 500 is about 33x, a very high figure, which translates into a forward 10-year annualized return of just about 4.5%, or less than half of the 11.9% annualized return generated over these last 10 years.
Another way of viewing the CAPE ratio vs. forward returns is shown in this next graphic:
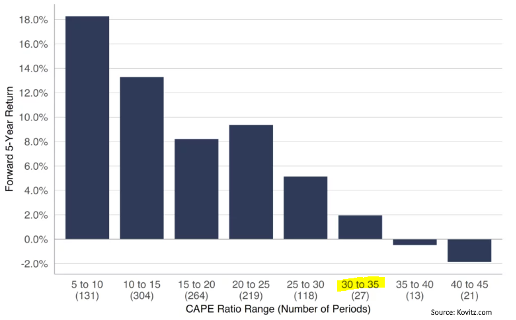
CAPE ratios for the S&P 500 are grouped in buckets on the horizontal axis and subsequent 5-year returns are shown on the vertical axis. Given the current CAPE ratio of 33x, the S&P 500 can be expected to generate an annualized return of just 2% over the next five years.
In summary, based on a very elevated current CAPE ratio, the S&P 500 has historically gained very meager future returns, in this case about 2% annualized over the next five years and about 4.5% annualized over the next 10 years. So let’s return to the original question, if US large-caps are likely not the place to be in the next 5-10 years, what will be? The fact is today we cannot immediately identify what will be the big winner over the next 5-10 years. But it’s our job to eventually arrive at these future winning asset classes and we have full confidence in our proven investment process to effectively navigate the global market landscape over time and determine such winners.
That said, we can offer some possibilities on what could become the asset classes to overweight in the future. As already discussed, very high valuations typically lead to very low forward returns, and vice versa, very cheap valuations typically lead to quite high forward returns.
So what is relatively undervalued right now?
As shown in this next chart, US small-caps have not been this cheap versus US large-caps since the internet/tech stock bubble in 2000.
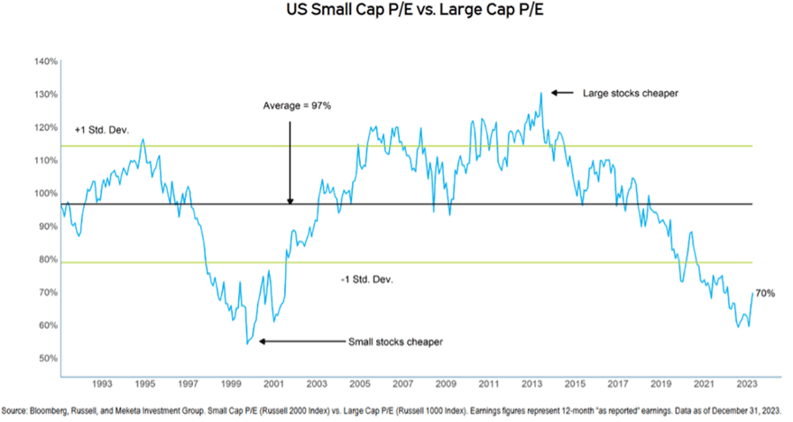
Note that after the stock market peak in March 2000, over the next five years US small-caps (Russell 2000) enjoyed a total gain of approximately 43% compared to a negative total return of -13% for US large-caps (S&P 500).
Another potential big winner in the future could be US value stocks. Compared to US growth stocks, valuations are relatively cheap for value stocks. The following chart shows the forward P/E for the Russell 1000 Value Index at discounted levels relative to the Russell 1000 Growth Index, levels not seen since the 2000 market bubble.
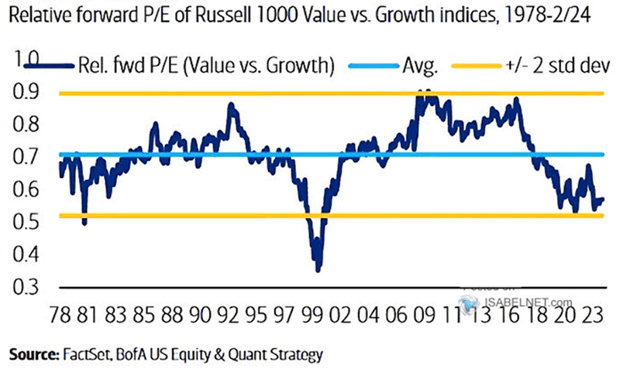
Again, it’s interesting to note that the Russell 1000 Growth Index peaked in August 2000 and over the next seven years this Index suffered a decline of -30%, as compared to the Russell 1000 Value Index which appreciated by nearly 70% in that time.
As a final example, non-US stocks may well become the preferred asset class over the next 5-10 years. This next chart shows the forward P/E of the MSCI All Country World ex-US Index relative to the forward P/E of the S&P 500:
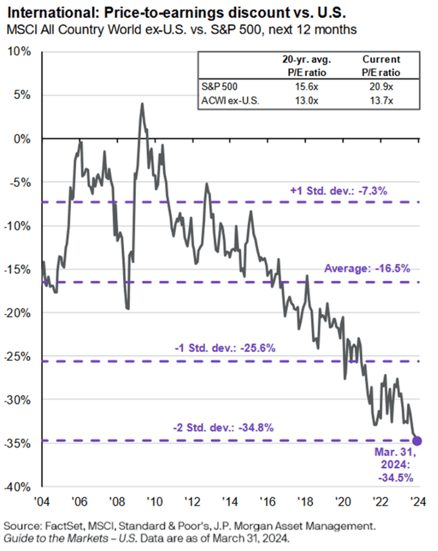
The ACWI ex-US index has a forward P/E of 13.7x, which is 35% less than the S&P 500’s forward P/E of 20.9x. Although non-US stocks are certainly cheap compared to US stocks, they will likely remain steeply undervalued as long as the US dollar continues to exhibit strength versus other currencies.
Bottom line: based on historical evidence (and not just my opinion), with respect to asset class returns, the next 5-10 years probably won’t look like the last 10 years. But not to worry, as a Measured Wealth client, you’re in very good hands!
As always, if you have any questions, please feel free to call or email.
The entire team at Measured Wealth wishes to thank you for entrusting us to deliver on your financial goals.
Edward Miller, CFA, CMT
Chief Investment Officer
Measured Wealth Private Client Group
Important Disclosures
Historical data is not a guarantee that any of the events described will occur or that any strategy will be successful. Past performance is not indicative of future results.
Returns citied above are from various sources including Factset, Bloomberg, Russell Associates, S&P Dow Jones, MSCI Inc., The St. Louis Federal Reserve and Y-Charts, Inc. The content is developed from sources believed to be providing accurate information. The information in this material is not intended as tax or legal advice. Please consult legal or tax professionals for specific information regarding your individual situation. The opinions expressed and material provided are for general information and should not be considered a solicitation for the purchase or sale of any security. Investing involves risks, including possible loss of principal. Please consider the investment objectives, risks, charges, and expenses of any security carefully before investing.
In order to provide effective management of your account, it is important that we have current information regarding your financial status and circumstances. Please contact us in writing at 303 Islington Street, Portsmouth, NH 03801 if you have any changes in your financial situation or investment objectives, and whether you wish to impose any reasonable restrictions on the management of the account or reasonably modify existing restrictions.
Measured Wealth Private Client Group, LLC is an investment adviser located in Portsmouth, New Hampshire. Measured Wealth Private Client Group, LLC is registered with the Securities and Exchange Commission (SEC). Registration of an investment adviser does not imply any specific level of skill or training and does not constitute an endorsement of the firm by the Commission. Measured Wealth Private Client Group, LLC only transacts business in states in which it is properly registered or is excluded or exempted from registration.
This publication is provided to clients and prospective clients of Measured Wealth Private Client Group, LLC for general informational and educational purposes only. It does not: (i) consider any person's individual needs, objectives, or circumstances; (ii) contain a recommendation, offer, or solicitation to buy or sell securities, or to enter into an agreement for investment advisory services; or (iii) constitute investment advice on which any person should or may rely. Past performance is no indication of future investment results. This publication is based on information obtained from third parties. While Measured Wealth Private Client Group, LLC seeks information from sources it believes to be reliable, Measured Wealth Private Client Group, LLC has not verified, and cannot guarantee the accuracy, timeliness, or completeness, of the third-party information used in preparing this publication. The third-party information and this publication are provided on an “as is” basis without warranty.
This publication may contain forward-looking statements relating to the objectives, opportunities, and the future performance of the U.S. market generally. Forward-looking statements may be identified by the use of such words as; “should,” “estimated,” “potential” and other similar terms. Examples of forward-looking statements include, but are not limited to, estimates with respect to financial condition, results of operations, and success or lack of success of any particular investment strategy. All are subject to various factors, including, but not limited to general and local economic conditions, changing levels of competition within certain industries and markets, changes in interest rates, changes in legislation or regulation, and other economic, competitive, governmental, regulatory and technological factors affecting a portfolio's operations that could cause actual results to differ materially from projected results. Such statements are forward-looking in nature and involve a number of known and unknown risks, uncertainties and other factors, and accordingly, actual results may differ materially from those reflected or contemplated in such forward-looking statements. Prospective investors are cautioned not to place undue reliance on any forward-looking statements or examples. None of Measured Wealth Private Client Group, LLC or any of its affiliates or principals nor any other individual or entity assumes any obligation to update any forward-looking statements as a result of new information, subsequent events or any other circumstances. All statements made herein speak only as of the date that they were made.
.png?width=352&name=Miller%20Commentary%20featured%20image%20(4).png)