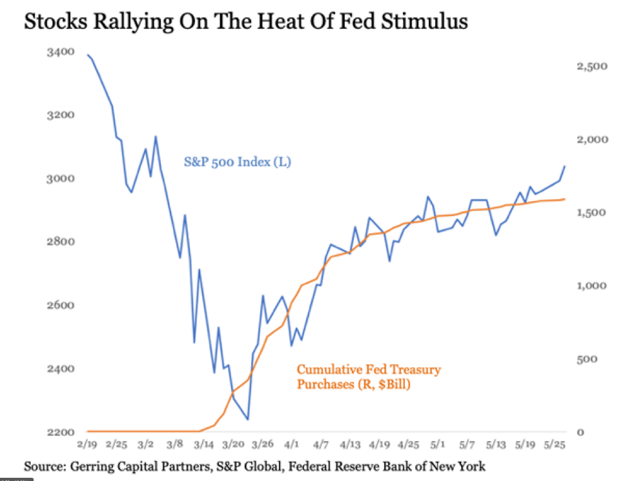
You may have heard the old investing mantra, "Don't fight the Fed." But what does it mean? Federal Reserve policy (aka monetary policy) has an enormous impact on investment results. We need not go any further back into history to see this mantra in action than the second quarter of 2020. During the “dark days” of late March and early April, we saw the Fed expand its balance sheet by 70% over a very short period, injecting nearly $3T dollars into the US economy. Financial markets of all flavors responded positively to say the least.
In fact, the second quarter looked like a mirror image of the first as evidenced by this graphic from Royce Investment Partners:
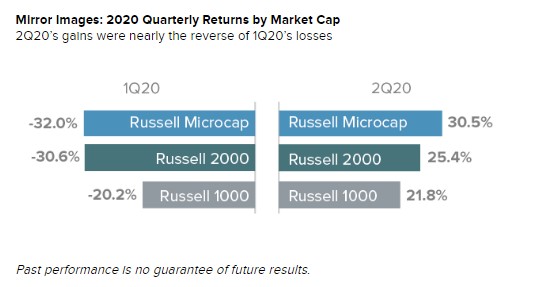
The S & P 500 performed similarly to the Russell 1000: down 20% in Q1 and up 20% in Q2. Again, bonds and gold were up in both quarters.
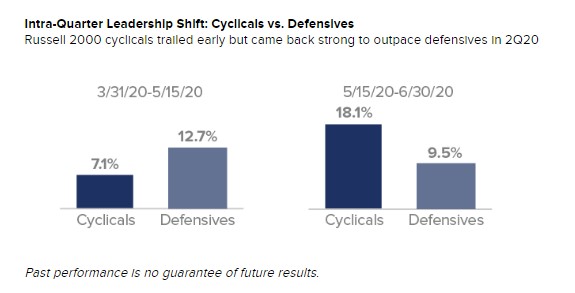
There were some notable dynamics within US equities as the leadership baton shifted from defensive stocks to cyclical stocks as the quarter wore on:
 Source: Royce Investment Partners
While the S & P 500 remains slightly negative on a Year to Date basis, the NASDAQ-100 did not get the COVID-19 memo and trades at an all-time high:
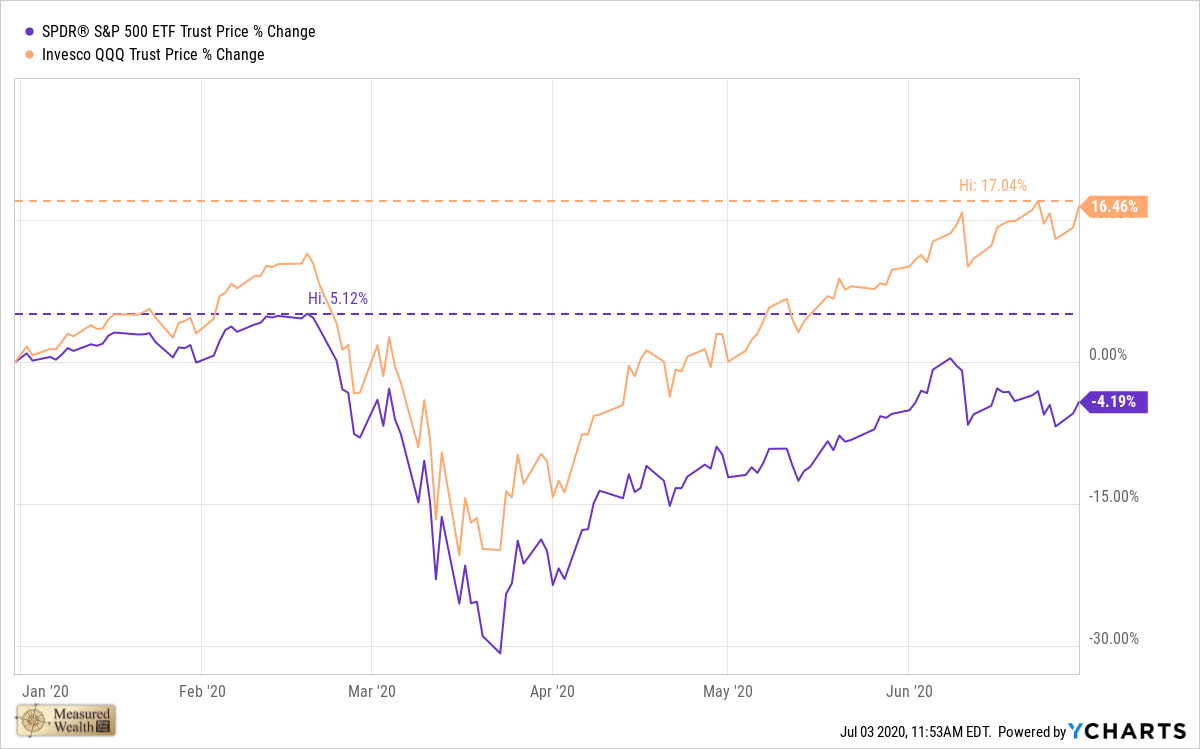
There is more to this part of the story as five stocks have driven most of the recovery in the S & P 500 (22% of the total capitalization) and all the outperformance by the NASDAQ-100 (46% of the total capitalization):
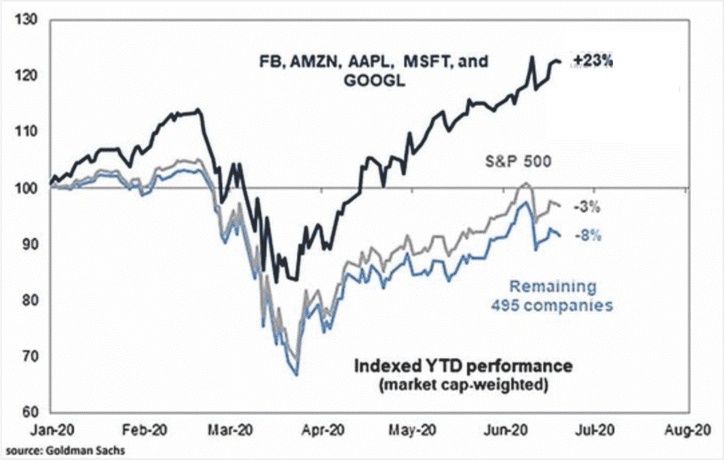
This is an issue we are closely monitoring as the potential for a bubble forming within this narrow group of stocks is real. Lest you think your commentator is an old Luddite at heart – the reality is I managed multiple billions of dollars in Technology stocks between 1990 and 2010 – I have been to the Tech Bubble party before:
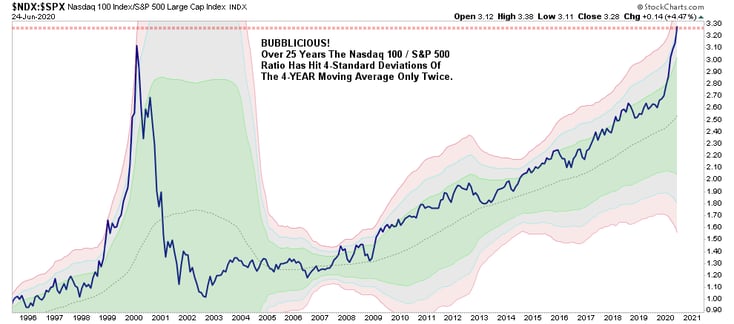
Source: StockCharts.com
In case you missed it, on June 8th, the National Bureau of Economic Research (NBER), whose job it is to date such things, established March 2020 as the first recessionary month in nearly 11 years – ending the longest peacetime expansion on record. Remember the stock market is a discounting mechanism and decided back in February that a recession had started and similarly decided in April that it would not be a long one. Investors have decided to “look over the valley” in corporate earnings for this year and treat the pandemic more like a natural disaster rather than a prolonged recession. In last quarter’s client letter, we wrote the following:
We certainly have a giant consensus that the virus will take a long time to resolve and financial markets are unlikely to recover for the foreseeable future. Corporate insiders appear to be a tiny group that is dissenting. Based on that, we could put in a final bottom sometime over the next few months before markets recover. There are quite a few unknowns at present and markets hate uncertainty.
One of the first things I was taught as a “young investor” over 30 years ago was that the market over-discounts known negatives or as veteran investor Bob Farrell put it:
“When all the experts and forecasts agree — something else is going to happen.”
While the “talking heads” in the media were wringing their hands over the state of the economy of the last few months, the reality was much different. It is quite likely that the economy had begun its recovery in May. Some data points to support this:
- Continuing claims fell 3.86 million to 21.05 million in the week ending May 16, the first decline since February. The reason that is important is that, typically, the economy has hit bottom when continuing claims peak or slightly before. In other words, the economy may have hit bottom in early May.
- The Kansas City Fed index showed a rise to -19 in May from -30 in April (in other words, things were “less bad”).
- The ISM Non-Manufacturing index rose to 45.4 in May, beating the consensus expected 44.4. (Levels above 50 signal expansion; levels below 50 signal contraction.) The major measures of activity were mostly higher in May. The business activity index rose to 41.0 from 26.0 in April, while the new orders index increased to 41.9 from 32.9. The employment index moved higher to 31.8 from 30.0 in April.
- Nonfarm payrolls rose 2,509,000 in May, easily beating the consensus expected decline of -7,500,000. Private sector payrolls rose 3,094,000 in May. The largest increases were for restaurants & bars (1,371,000), construction (464,000), health care & social assistance (391,000), and retail (368,000). Manufacturing rose 225,000 while government declined 585,000. The unemployment rate dropped to 13.3% in May from 14.7% in April. Total hours worked increased 4.3% in May
- Retail sales rose 17.7% in May (+20.2% including revisions to prior month), easily beating the consensus expected increase of 8.4%. Sales excluding autos rose 12.4% in May (+15.4% including revisions to prior months). The consensus expected an increase of 5.5%. Excluding gas, sales rose 18.0% in May. The surge in sales in May was led by autos, restaurants & bars, and non-store retailers (internet & mail order). No category declined in May.
- Headline industrial production and its manufacturing subcomponent rose 1.4% and 3.8%, respectively in May. Shipments of "core" non-defense capital goods ex-aircraft (a key input for business investment in the calculation of GDP growth), rose 1.8% in May.
- New orders for durable goods increased 15.8% in May, easily beating the consensus expected gain of 10.5%. Orders excluding transportation rose 4.0% in May, also beating the consensus expected gain of 2.1%.
- The latest reading (June 19th) on initial unemployment claims, which came in at 1.48 million last week, maintaining the spate of extremely high readings since March. However, initial claims have now dropped twelve weeks in a row after peaking at 6.87 million in late March. Continuing claims fell 767,000 to 19.52 million in the week ending June 12 and have fallen consistently since the peak of 24.91 million at the beginning of May.
- The ISM Manufacturing Index rose to 52.6 in June, easily beating the consensus expected 49.8. (Levels higher than 50 signal expansion; levels below 50 signal contraction.) The major measures of activity were mostly higher in June. The new orders index rose to 56.4 from 31.8 in May, while the production index increased to 57.3 from 33.2. The employment index moved higher to 42.1 from 32.1.
- Nonfarm payrolls rose 4.80 million in June, beating the consensus expected gain of 3.23 million. Private sector payrolls rose 4.767 million in June. The largest increases were for restaurants & bars (2.088 million), retail (740,000), and education & health services (568,000). Manufacturing rose 356,000 while government increased 33,000. The unemployment rate dropped to 11.1% in June from 13.3% in May. Aggregate hours worked rose 3.6% in June. After plummeting at the fastest pace ever in April, nonfarm payrolls rose at the fastest pace ever in May and have done so again in June, adding 4.8 million jobs for the month. Even better, almost all the gain was in the private sector, with leisure and hospitality leading the way, while retail, education & health services, and manufacturing also adding a substantial number of jobs as well. The labor market has a long road ahead to be fully healed, but, in the past two months, has recovered one-third of the payrolls lost in March and April. Civilian employment, an alternative measure of jobs that includes small-business start-ups, tells a similar story, up 4.94 million in June - also regaining in May and June one-third of the employment lost in March and April.
If this comes as a surprise to you and you missed all the evidence on the emerging economic recovery – perhaps it is time to change your source of news.
We at Measured Wealth hope you and your family have an enjoyable and safe Summer. Please call or email if you have any questions.
Steve Bruno, CFA
Chief Investment Officer
July 3, 2020
Disclaimer: Historical data is not a guarantee that any of the events described will occur or that any strategy will be successful. Past performance is not indicative of future results.
Returns citied above are from various sources including Bloomberg, Russell Associates, S&P Dow Jones, MSCI Inc., The St. Louis Federal Reserve and Y Charts, Inc.