In a rather famous speech, prior Federal Reserve chairman Alan Greenspan (aka, “The Maestro”), said:
"Clearly, sustained low inflation implies less uncertainty about the future, and lower risk premiums imply higher prices of stocks and other earning assets. We can see that in the inverse relationship exhibited by price/earnings ratios and the rate of inflation in the past. But how do we know when irrational exuberance has unduly escalated asset values, which then become subject to unexpected and prolonged contractions as they have in Japan over the past decade? And how do we factor that assessment into monetary policy?”
Markets got the message, at least based on the knee-jerk reaction that sent stock futures and the dollar tumbling off-hours. But markets also felt empowered to ignore the Fed chairman. If Greenspan intended, as he later admitted, to knock some wind out of stocks, his impact was not long-lasting. From there, stocks rallied for more than three years before the dot-com bubble finally burst in 2000. Did Greenspan know the potential power of those words, which he has said he came up with while working on the speech in the bathtub? He sure did: “I was acutely aware of the fact that that particular phrase was put in that speech to spook the market,” Greenspan said in a later interview with the Wall Street Journal. How does Greenspan, reflect on the speech and market reaction? “If you rate me on my ‘irrational exuberance’ forecast, I get a C,” he conceded. “But analytically, it was describing a process that I thought we had to be very concerned about.” That speech was delivered December 5th, 1996.
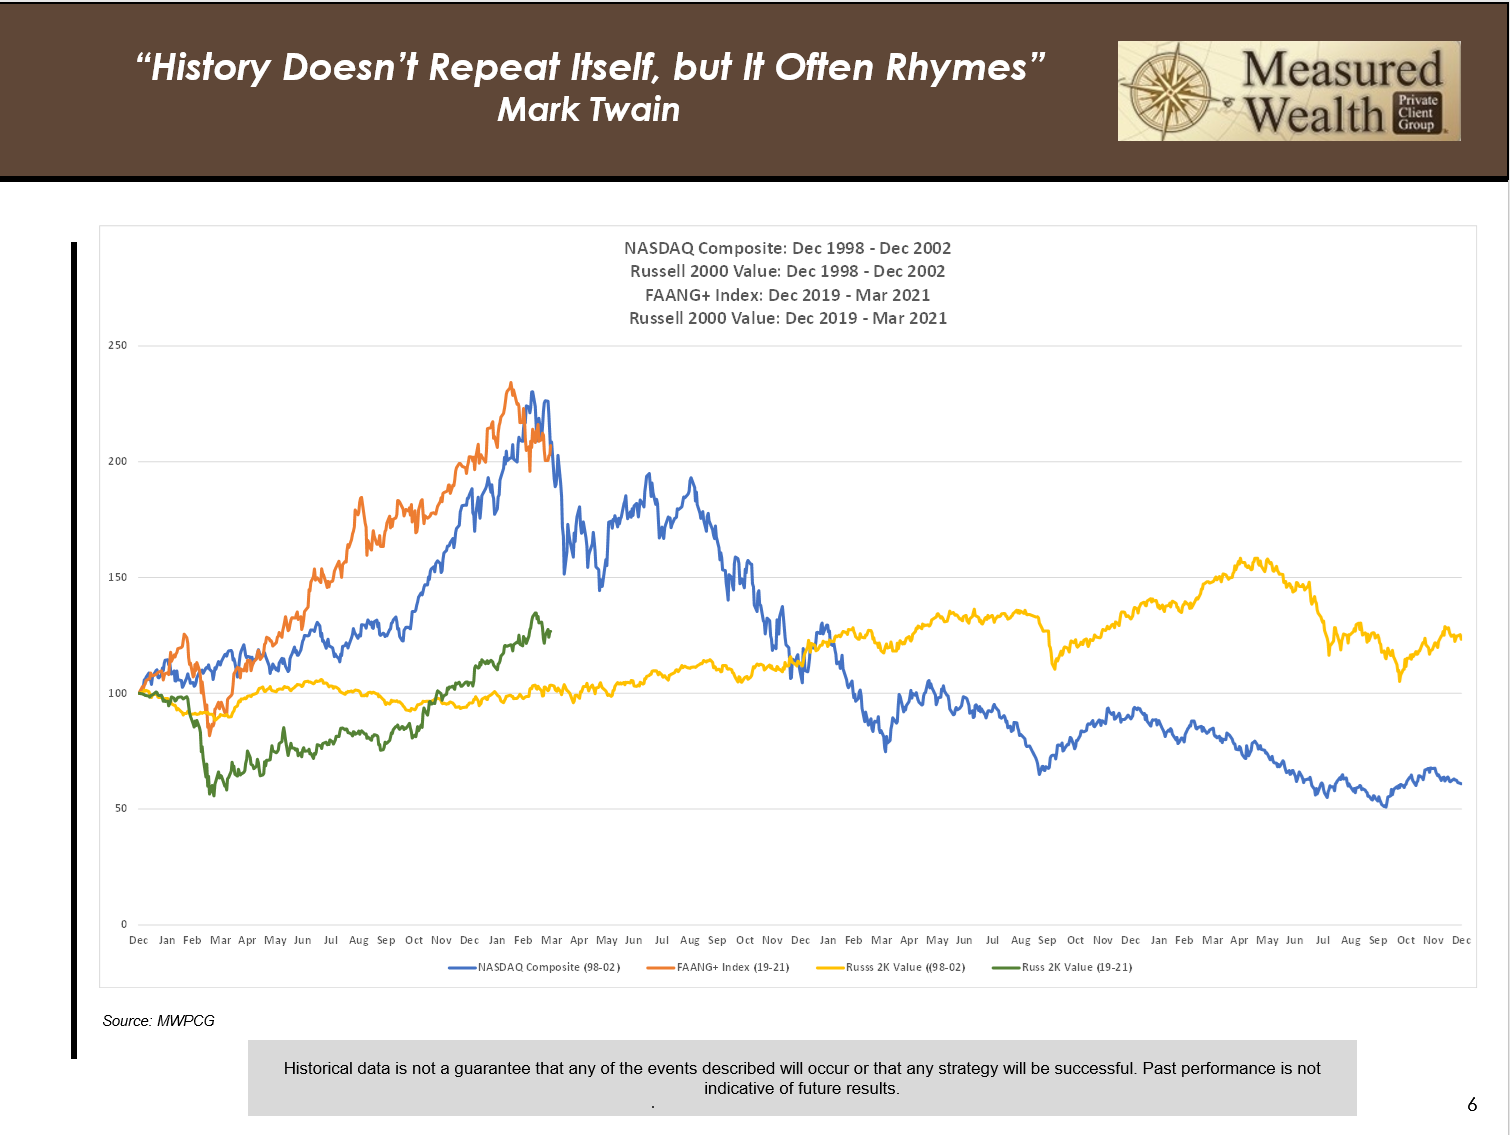
Fast forward to today. In the chart below, we have superimposed the NASDAQ index from December 1998 to December 2002 (blue line) with the FAANG+ index (orange line) which we have written about previously for the period December 2019 to March 2021. The green and yellow lines represent the Russell 2000 Value for the same periods. Bottom line: we believe the relative performance race will continue to tilt toward Value.
In our third quarter letter to you last year we wrote:
“The recent flood of liquidity injected into the global economy that we have discussed in prior letters is likely to be enough to rekindle inflation. As such, we believe that interest rates have seen their lows for this cycle, growth stocks are quite vulnerable to rising interest rates and commodity prices will rise more than expected over the next several years. The changes to your portfolio in early August manifested themselves as a reduction in growth stock exposure, a negative position on treasury yields (where appropriate) and the addition of an ETF with broad commodity exposure.”
The Consumer Price Index (CPI) is one of the most important measures of inflation and is followed closely by the Federal Reserve, businesses, and governments. Reflecting this, potential biases and measurement problems with the CPI have long been a topic of research interest. Ultimately, all CPI measurement issues must be viewed while considering the stated measurement goal of the CPI, which has explicitly been a cost-of-living index (COLI) since it was recommended by the Boskin Commission in 1995 and shortly after accepted by the Bureau of Labor Statistics (BLS). Specifically, the BLS Handbook of Methods defines a COLI for the current month as answering the following question:
What is the cost, at this month’s market prices, of achieving the standard of living actually attained in the base period?
The cost-of-living measurement goal explains when and why inflation for durable goods (e.g., housing) should be measured differently than for non-durable goods (e.g., food). Usually consumer price indices, including the CPI, only consider expenditures on goods as all occurring in the period that the good is purchased. This is known as the acquisitions approach. The problem with an acquisitions approach for durable goods is that they represent both current and future services. Yet, as discussed, the cost-of-living measurement assumes that the benefits that a consumer receives from the durable good only occurs during the measurement period (1-month). Shelter costs make up nearly 32% of the CPI, with the owner-occupied housing (OOH) portion comprising 24+% and rent of primary residence making up 6+%. This means shelter costs are the single largest component in the CPI. It is not immediately obvious that rents should be used to measure inflation in the owner-occupied housing services portion, thus, it is necessary to first establish a justification for what is known as rental equivalence.
A COLI attempts to measure the changes in the cost of achieving a particular level of satisfaction for a given consumer. Market rents reflect current market conditions and are based on prices that a marginal buyer or seller in the market would face. This is how prices are measured for all non-housing items in the CPI. The separate treatment of housing is because its useful life averages tens of years (making it a “durable” good), and so the consumption is much slower, and the divergence between acquisition cost and cost of the flow of services is potentially much larger. In recognition of this fact, the BLS focuses on measuring the cost of consuming housing services. However, the market price of owner-occupied housing services is not directly observable, therefore indirect measurement techniques must be used. There are two primary ways to measure housing services that are considered by price statisticians and the BLS in particular: user cost and owners’ equivalent rent (OER). The theoretical equality between OER and the user cost of housing has historically been an important justification for using OER. That is, the user cost represents the theoretically appropriate measurement, and OER should be equivalent to it. However, the failure of this equality to hold has led economists to increasingly recognize the so-called “opportunity cost” justification for rental equivalence as being more theoretically important. This takes several conceptual forms, but the underlying concept is that the rental price of a house represents the opportunity cost of owning it, (i.e., owners could rent the house out or forego this rent to live there). In other words, the opportunity cost approach is asking:
How much richer would the homeowner be if he or she did not consume the housing services provided by a dwelling?
To answer this, it is argued, one should look at the rents that homeowners could have earned had they rented their homes instead of consuming the housing services (living in it). The choice that the opportunity cost considers makes it clear that what should be considered is market rents and not average rents. If a homeowner were to rent her house, the price she could get is the current market price for those services. The average price consists of current market prices from past periods which are irrelevant to someone who wishes to sell housing services (rent their house) in the current market. The average price is a choice which is unavailable in the current period. In contrast, average rents which are used in the CPI shelter cost calculation are based on average household rent expenditures. The two measurements can diverge primarily because rents are typically set by long-term leases, such that the current price that a unit would rent for (which would be used in market rent measures) may not be the same as the current rent paid by that unit’s tenant (which is used in average rent). Average rents are often set months or even years in the past while market rents reflect current prices. For non-durable goods, the price a household pays for consumption in a given month is typically set in that same period. As a result, the average price, as measured by a survey of household spending, should be close to market prices of the actual goods and services consumed in that period, as measured by changes in average current prices. In contrast, housing rents are typically set in long-term leases and the amount that households pay every month change infrequently thus responding slowly to changes in market prices as contracts expire and are renegotiated. This nominal price rigidity of housing rents can create a large divergence between the two measurement methods. There are a variety of potential causes for the price rigidity of housing, but the shared feature is that tenants receive rents below market value as their tenure length increases (i.e., tenure discounts). Economic research shows that the convention of using previous period’s rent saves the cost of information acquisition, bargaining time, and emotional stress of renegotiation for both landlord and tenant. A similar transaction cost-based explanation for tenure discounts focuses on the transaction cost of outside options. This occurs if, as tenure length increases, the cost of choosing an outside option increases for the tenant or the landlord. There is evidence that new tenant costs on the part of the landlord are substantial with one estimate of turnover costs related to painting, decorating, and lost rents of around $1,174 per tenant. The evidence suggests that the aforementioned mismeasurement causes real underlying shelter price changes to show up slowly in measured inflation1. Class dismissed.
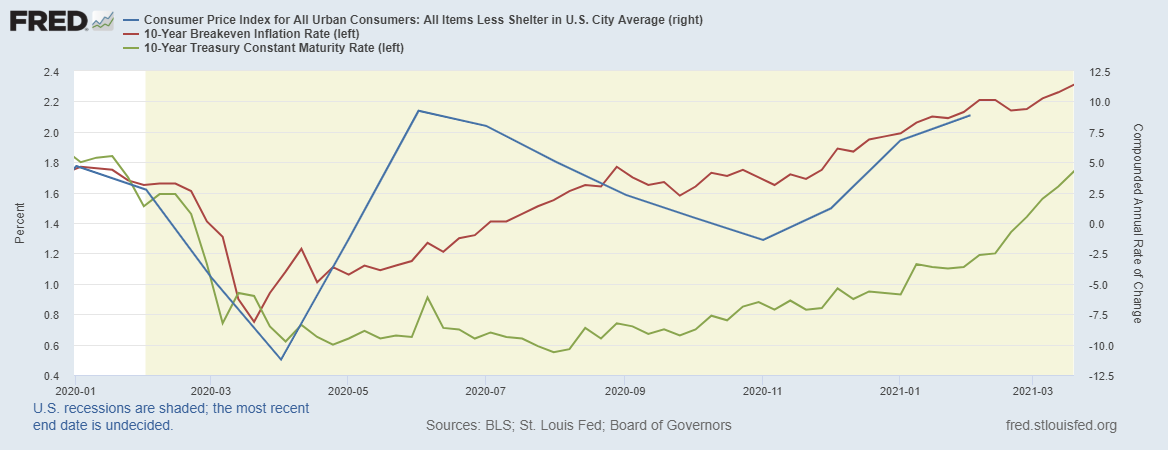
Why should you care about the arcane world of how the CPI is calculated? Because when you strip out the distortions associated with the measurement of shelter costs – the CPI rose at an 8.9% annualized rate in February of 2021 with future inflation expectations and Treasury bond yields continuing to rise in response.
See disclosures below.
We see no reason to change how your portfolios are positioned at this time.
We at Measured Wealth hope you and your family remain healthy. Please call or email if you have any questions.
Steve
Steve Bruno, CFA
Chief Investment Officer
April 1, 2021
1 A similar problem can be found in the healthcare weighting which, at 6%, is most certainly low, but worse, it does not necessarily measure the right prices. The calculation simply assumes Medicare reimbursement rates, which are basically government-dictated price controls. Many hospitals and other healthcare providers lose money on Medicare patients and make it up from the higher payments they get from private insurers. Healthcare costs have been rising more than 4% on average every year for the last decade.
Disclaimer: Historical data is not a guarantee that any of the events described will occur or that any strategy will be successful. Past performance is not indicative of future results.
 The broad US Bond market was down over 3.3% for the quarter, with Treasury prices sinking the most since 1980. The long end of the Treasury yield curve (20+ years) was down 13.5% for the quarter. Other areas of the fixed income markets such as Preferreds, High Yields and International bonds were +/- less than 1.0%, thus avoiding the carnage which occurred in the US Treasury market. Despite rising bond yields, the S & P 500 was up over 6.0% for the quarter, though the NASDAQ Composite was up a more modest 3.0%. Size continued to play a major role as small caps again outperformed large caps with the Russell 2000 up 13.0%. Value outperformed Growth again this quarter with cyclically sensitive stocks such as Industrials, (+12%), Basic Materials (+10%) and Energy (+30%) continuing to outperform the early Pandemic favorites such as Technology(+3%) and Consumer Staples (+3%). Commodities continued to outperform, appreciating another 14.0% during the quarter, as the inflation concerns we talked about last year have become a major area of focus among investors.