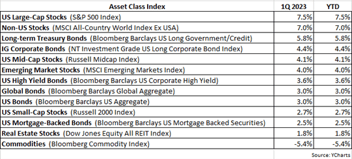
Equity markets certainly started 2025 on a bearish note. After trading near breakeven YTD through February, the S&P 500 Index declined by -5.5% in March and plunged further at the start of April, hitting a YTD low of -15% on April 8th. Since then, the Index has attempted a comeback, rising by 11.7% through the end of April.
While any equity rally is always welcomed, the main question facing investors at this point is whether this recent push higher marks the start of a new bull market or a bear market rally. We’re betting on the latter. Some of the most impressive rallies occur during bear markets, as investors cling to hope and buy after a significant decline, only to see equities roll over and further sink to new lows. Attempting to time the exact bottom of a bear market is almost always exceedingly difficult and can lead to significant regrets and financial losses. Fortunately, we closely track many indicators that collectively have a solid record for navigating all market cycles, and in general, it doesn’t appear as if we’re out of the woods yet.
In addition to deciphering the nature of this recent rally (a new bull market or a bear market rally), investors are also trying to determine whether the current bear market is structural or event-driven. A structural bear market typically involves an economic recession, significant corporate failures or credit market dislocations, and they can last 1-3 years with declines of worse than -50%. In contrast, event-driven bear markets are triggered by a cataclysmic, specific event that shakes the confidence of investors, resulting in a sharp but short-lived selloff of equities. The COVID-led market plunge in 2020 was a classic event-driven bear market.
So which one best fits the current bear market, structural or event-driven? Although introducing tariffs would qualify as an event, at this point it’s unclear if they will drive the US economy into recession. If we’re able to dodge a recession, perhaps due to the tariffs being negotiated much lower, the market correction could then be an event-driven occurrence, likely to last just weeks or months, not years. However, if we do enter an economic recession, with the tariffs being the primary driver, the bear market will then become structural in nature.
Further perplexing investors is President Trump’s unpredictability. As I wrote in the 1Q 2025 investment letter, “A major unknown is President Trump could decide to negotiate these tariffs lower or even cancel them entirely (he can be very unpredictable!).” The fact that there’s such extreme uncertainty regarding the fate of the tariffs makes it nearly impossible for investors to confidently anticipate the future. In such an environment, market volatility can persist for an extended period.
We continue to maintain a defensive position with our client portfolios. BUT we are prepared to abruptly shift allocations if the tariffs are indeed negotiated meaningfully lower. Only time will tell.
The following items are worth highlighting.
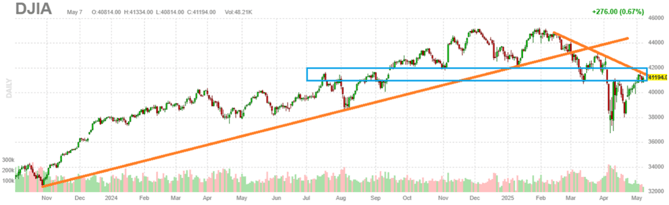
The above chart depicts the DJ Industrial Average, but several major US equity indices look similar to this index. Notice the extended rising trend line (orange) was pierced to the downside at the end of this past February, indicating a possible change in trend. After continued downward movement by the index, a new declining trend line (orange) has formed. In addition, the rectangular box (blue) identifies a price area of potential resistance, meaning the index could have a tough time getting through this price area. Currently, the index is meeting up against both the declining trend line and the blue rectangular box. Again, we believe odds favor US equities rolling over from here, unsuccessfully getting through this price resistance area.
As for valuation, even after the recent price correction, most indices remain historically overvalued.
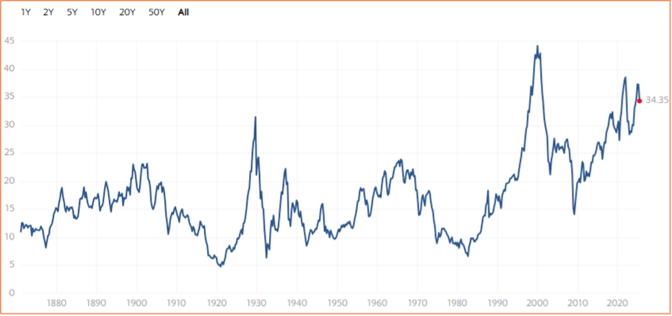
The chart above shows one of our favorite valuation measures, the CAPE ratio. CAPE stands for “cyclically-adjusted P/E,” which uses earnings per share over a rolling 10-year period to smooth out any cyclical fluctuations in profits. The chart dates back to 1870 and in that time the CAPE ratio has averaged around 17. Currently the CAPE ratio is 34 or double the 100+ year average. Such an elevated figure does not bode well for future returns.
As already mentioned, the jury is still out concerning the likelihood of an imminent economic recession. Yet there are several trusted indicators flashing red, suggesting at minimum the economy will slow in the near future. One such indicator is the median sales price of houses sold, as shown in the following chart:
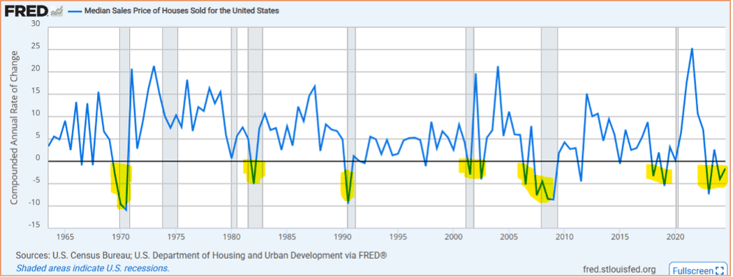
The above chart dates back to 1960 and shows the compounded annual rate of change of the median home price when sold. The grey shaded areas represent recessions. When this indicator gets below 0% (see yellow shading), it typically has preceded or occurred during a recession. And currently the blue line has been and remains below 0%.
Finally, when it comes to seasonality, equity markets are entering a distinctly bearish time period.
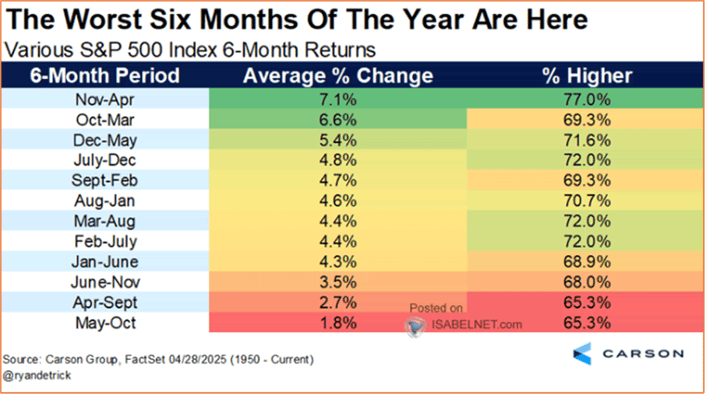
The above table lists in best-to-worst order all the combinations of rolling 6-month calendar returns for the S&P 500 Index. Since 1950, the best 6-month period for the S&P 500 has been November through April, generating an impressive 7.1% return in those six months. The worst period was May through October, posting an anemic return of 1.8%. In short, for the next six months, calendar seasonality is a noteworthy headwind for stocks.
As already stated, we remain defensively positioned as our investment process maintains that all things considered, the current environment warrants an emphasis on capital preservation over seeking more speculative sources of returns.
If you have any questions, please feel free to call or email.
The entire team at Measured Wealth wishes to thank you for entrusting us to deliver on your financial goals.
Edward Miller, CFA, CMT
Chief Investment Officer
Measured Wealth Private Client Group
Important Disclosures
Historical data is not a guarantee that any of the events described will occur or that any strategy will be successful. Past performance is not indicative of future results.
Returns citied above are from various sources including FactSet, Bloomberg, Russell Associates, S&P Dow Jones, MSCI Inc., The St. Louis Federal Reserve and Y-Charts, Inc. The content is developed from sources believed to provide accurate information. The information in this material is not intended as tax or legal advice. Please consult legal or tax professionals for specific information regarding your individual situation. The opinions expressed and material provided are for general information and should not be considered a solicitation for the purchase or sale of any security. Investing involves risks, including possible loss of principal. Please consider the investment objectives, risks, charges, and expenses of any security carefully before investing.
In order to provide effective management of your account, it is important that we have current information regarding your financial status and circumstances. Please contact us in writing at 303 Islington Street, Portsmouth, NH 03801 if you have any changes in your financial situation or investment objectives, and whether you wish to impose any reasonable restrictions on the management of the account or reasonably modify existing restrictions.
Measured Wealth Private Client Group, LLC is an investment adviser located in Portsmouth, New Hampshire. Measured Wealth Private Client Group, LLC is registered with the Securities and Exchange Commission (SEC). Registration of an investment adviser does not imply any specific level of skill or training and does not constitute an endorsement of the firm by the Commission. Measured Wealth Private Client Group, LLC only transacts business in states in which it is properly registered or is excluded or exempted from registration.
This publication is provided to clients and prospective clients of Measured Wealth Private Client Group, LLC for general informational and educational purposes only. It does not: (i) consider any person's individual needs, objectives, or circumstances; (ii) contain a recommendation, offer, or solicitation to buy or sell securities, or to enter into an agreement for investment advisory services; or (iii) constitute investment advice on which any person should or may rely. Past performance is no indication of future investment results. This publication is based on information obtained from third parties. While Measured Wealth Private Client Group, LLC seeks information from sources it believes to be reliable, Measured Wealth Private Client Group, LLC has not verified, and cannot guarantee the accuracy, timeliness, or completeness, of the third-party information used in preparing this publication. The third-party information and this publication are provided on an “as is” basis without warranty.
This publication may contain forward-looking statements relating to the objectives, opportunities, and the future performance of the U.S. market generally. Forward-looking statements may be identified by the use of such words as; “should,” “estimated,” “potential” and other similar terms. Examples of forward-looking statements include, but are not limited to, estimates with respect to financial condition, results of operations, and success or lack of success of any particular investment strategy. All are subject to various factors, including, but not limited to general and local economic conditions, changing levels of competition within certain industries and markets, changes in interest rates, changes in legislation or regulation, and other economic, competitive, governmental, regulatory and technological factors affecting a portfolio's operations that could cause actual results to differ materially from projected results. Such statements are forward-looking in nature and involve a number of known and unknown risks, uncertainties and other factors, and accordingly, actual results may differ materially from those reflected or contemplated in such forward-looking statements. Prospective investors are cautioned not to place undue reliance on any forward-looking statements or examples. None of Measured Wealth Private Client Group, LLC or any of its affiliates or principals nor any other individual or entity assumes any obligation to update any forward-looking statements as a result of new information, subsequent events or any other circumstances. All statements made herein speak only as of the date that they were made.