By Edward Miller, CFA®, CMT®
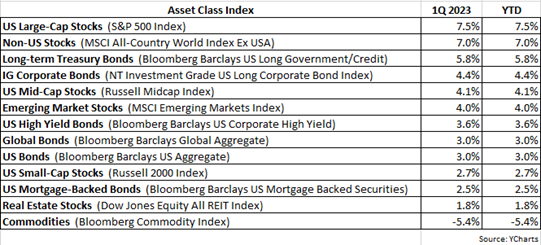
Following the worst year for US stocks since 2008, and the worst year for US bonds on record, 2023 has started off on an optimistic note with both stocks and bonds posting positive 1Q returns. The S&P 500 was up 7.5% and the Bloomberg Barclays US Aggregate Bond Index rose 3% in the quarter. Even non-US equities, which have underperformed US equities for more than ten years, participated in the gains as the MSCI All-Country World ex-USA Index returned an impressive 7% in the 1Q.
Notably, the major asset class that suffered negative returns in the 1Q was the best performing major asset class last year: commodities. The Bloomberg Commodity Index fell by -5.4% in the quarter, a decline primarily driven by the retreat in crude oil prices. Although the relatively high rate of inflation continues to be a key concern for investors, there are indications that pricing pressures are easing, as reflected by the drop in oil prices.
The 1Q could be characterized as a performance reversion quarter as many asset classes that did very well last year underperformed in the 1Q (such as commodities), and vice versa. In fact, the three worst performing equity sectors last year were Consumer Discretionary, Communication Services and Technology, and those three sectors were the best performing sectors in the 1Q. The new year saw investors become much more hopeful that inflation would continue to subside, allowing for the Fed to eventually halt further rate hikes, and higher beta stocks in these three sectors benefited from this rosy view.
In addition to a reversal of 2022 performance, the 1Q was also characterized by narrow leadership in many cap-weighted indices. For example, although the S&P 500 was up 7.5% in the quarter, 59% of the Index’s 1Q return was attributed to just four stocks, as shown in the following exhibit.

Equity returns from Apple, Microsoft, NVIDIA and Tesla comprised 4.39% of the 7.5% return for the S&P 500, or 59% of its quarterly return. To further highlight the extreme concentration of this performance, note that the equal-weighted S&P 500 (which weights each of the 500 stocks in the index equally) had a 1Q return of just 3.16%, or less than half the cap-weighted 7.5% return. When markets demonstrate such narrow leadership, it’s typically not a bullish or healthy sign; broad participation is much preferred!
Despite the positive 1Q, for approximately the past nine months the S&P 500 has returned about 0%, with the Index steadily rallying from the lows set last October to nearly matching its previous high established last August. As illustrated in the following chart, 4200 is a level that could prove to be difficult for the S&P 500 Index to successfully break through:
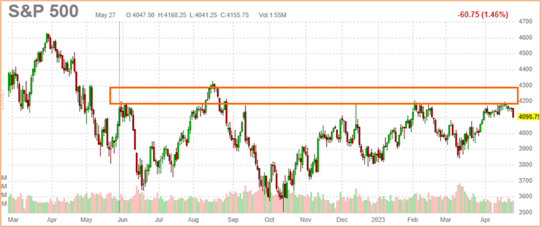
The elongated orange rectangle in the chart highlights an area that is often referred to as overhead resistance, which is a price level that appears to serve as a ceiling for further appreciation. Notice that on more than one occasion in the recent past, the S&P 500 has experienced trouble when attempting to get through this 4200 level. In a confirmed bull market, such overhead resistance usually does not pose a problem as investors are eager to buy, pushing prices higher as a result. But again referring to the above chart, since last June, the S&P 500 has tried on several occasions to get through this key level only to fail. When the Index has approached 4200, sellers have tended to outnumber buyers, ultimately forcing prices lower.
We believe that this overhead resistance will likely remain an obstacle until investors are able to gain more clarity on where the economy is headed, in addition to getting a better sense that the Fed is finished raising interest rates. As the following chart shows, there is a high (and increasing) probability that our economy will enter a recession in the near future.
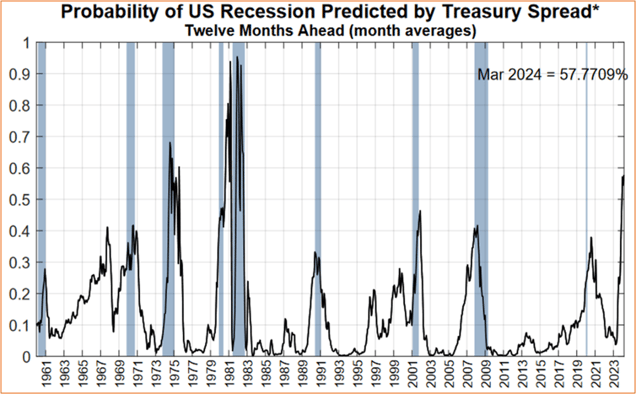
The chart is from the Fed Reserve Bank of New York and it displays the probability of a US recession over the next 12 months as predicted by the Treasury yield curve. The blue shaded areas in the chart represent recessions. When this indicator has spiked higher in the past, meaning the probability of a recession occurring is increasing, more often than not a recession has indeed occurred. Currently this indicator has the probability of a recession in the next 12 months at 58%, the highest level since August 1982.
It's worth reminding that stock prices tend to discount the future and the S&P 500 Index has historically declined 6-12 months before the onset of a recession. With the Index down about -18% last year, one could argue that stocks have already discounted an eventual recession. However, while it would seem investors have anticipated a slowdown in the economy, the question they’re grappling with is the severity of the expected slowdown. Will we experience a fairly mild and short downturn in the economy (a so-called “soft landing”), or will the eventual recession become protracted and painful? If we experience the latter, perhaps stocks have further to fall as most investors could be caught off guard, having expected the former, less dismal scenario.
Our client portfolios have been positioned defensively since late 2021 and have remained so to date. We track a multitude of indicators to help inform our investment decision process and while several have turned bullish over the last several weeks, the net balance of our indicators continues to skew bearish. Until we discern more of a definitive bullish signal, we intend to maintain a defensive and cautious posture for client portfolios.
As always, if you have any questions, please feel free to call or email. The entire team at Measured Wealth wishes to thank you for entrusting us to deliver on your financial goals.

Ed Miller, CFA, CMT
Chief Investment Officer
Measured Wealth Private Client Group
Important Disclosures
Historical data is not a guarantee that any of the events described will occur or that any strategy will be successful. Past performance is not indicative of future results.
Returns citied above are from various sources including Factset, Bloomberg, Russell Associates, S&P Dow Jones, MSCI Inc., The St. Louis Federal Reserve and Y-Charts, Inc. The content is developed from sources believed to be providing accurate information. The information in this material is not intended as tax or legal advice. Please consult legal or tax professionals for specific information regarding your individual situation. The opinions expressed and material provided are for general information and should not be considered a solicitation for the purchase or sale of any security. Investing involves risks, including possible loss of principal. Please consider the investment objectives, risks, charges, and expenses of any security carefully before investing.
In order to provide effective management of your account, it is important that we have current information regarding your financial status and circumstances. Please contact us in writing at 303 Islington Street, Portsmouth, NH 03801 if you have any changes in your financial situation or investment objectives, and whether you wish to impose any reasonable restrictions on the management of the account or reasonably modify existing restrictions.
Measured Wealth Private Client Group, LLC is an investment adviser located in Portsmouth, New Hampshire. Measured Wealth Private Client Group, LLC is registered with the Securities and Exchange Commission (SEC). Registration of an investment adviser does not imply any specific level of skill or training and does not constitute an endorsement of the firm by the Commission. Measured Wealth Private Client Group, LLC only transacts business in states in which it is properly registered or is excluded or exempted from registration.
This publication is provided to clients and prospective clients of Measured Wealth Private Client Group, LLC for general informational and educational purposes only. It does not: (i) consider any person's individual needs, objectives, or circumstances; (ii) contain a recommendation, offer, or solicitation to buy or sell securities, or to enter into an agreement for investment advisory services; or (iii) constitute investment advice on which any person should or may rely. Past performance is no indication of future investment results. This publication is based on information obtained from third parties. While Measured Wealth Private Client Group, LLC seeks information from sources it believes to be reliable, Measured Wealth Private Client Group, LLC has not verified, and cannot guarantee the accuracy, timeliness, or completeness, of the third-party information used in preparing this publication. The third-party information and this publication are provided on an “as is” basis without warranty.
This publication may contain forward-looking statements relating to the objectives, opportunities, and the future performance of the U.S. market generally. Forward-looking statements may be identified by the use of such words as; “should,” “estimated,” “potential” and other similar terms. Examples of forward-looking statements include, but are not limited to, estimates with respect to financial condition, results of operations, and success or lack of success of any particular investment strategy. All are subject to various factors, including, but not limited to general and local economic conditions, changing levels of competition within certain industries and markets, changes in interest rates, changes in legislation or regulation, and other economic, competitive, governmental, regulatory and technological factors affecting a portfolio's operations that could cause actual results to differ materially from projected results. Such statements are forward-looking in nature and involve a number of known and unknown risks, uncertainties and other factors, and accordingly, actual results may differ materially from those reflected or contemplated in such forward-looking statements. Prospective investors are cautioned not to place undue reliance on any forward-looking statements or examples. None of Measured Wealth Private Client Group, LLC or any of its affiliates or principals nor any other individual or entity assumes any obligation to update any forward-looking statements as a result of new information, subsequent events or any other circumstances. All statements made herein speak only as of the date that they were made.