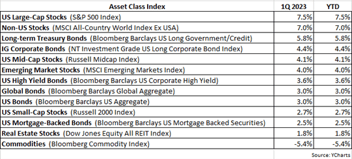
Stocks continued to rally in May, with the S&P 500 Index rising by 6.3% in the month. Since the April 8th low, the Index has risen 18.7%, as investors appear to remain optimistic that the economy can avoid entering a recession. As for fixed income, bonds struggled in May, as reflected by the -0.6% return for the Bloomberg US Aggregate Bond Index. Interest rates rose in the month, explaining much of the negative performance.
As we head into summer, seasonally a weak period for equities, the US economic picture remains somewhat muddled with several proven recession indicators sending a mixed message concerning the near future. For example, while retail sales and wage growth have been relatively strong, new orders in manufacturing (PMI) have contracted, and job sentiment has turned negative. Adding to the confusion is the uncertainty about US tariffs – will they be negotiated lower or even rescinded, or will a global trade war suddenly erupt?
In past client missives, we’ve mentioned how we greatly rely on our disciplined investment process to navigate through the economic landscape successfully. To help illustrate why client portfolios are positioned with over- and underweight exposures versus relevant benchmarks, I often show charts from several of our indicators, which hopefully make evident the reasoning behind our current investment stance. What follows are charts from two additional trusted indicators.
The unemployment rate can serve as a very prescient signal for eventual equity market moves. The chart below shows the S&P 500 in the upper inset (red line) and the unemployment rate in the lower inset (green line).
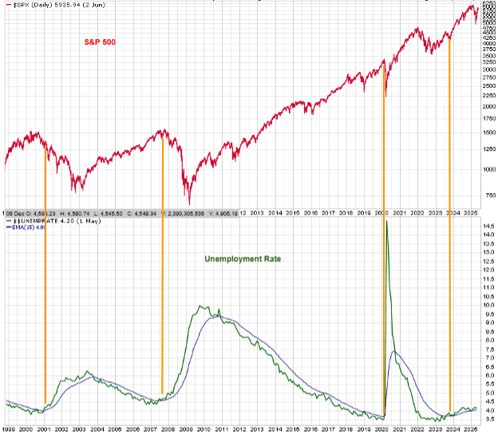
When the unemployment rate has risen above its longer-term moving average (blue line), stocks have typically declined not long after (see orange vertical lines). Notice that the unemployment rate rose above its moving average in late 2023 (one of several reasons for our defensive positioning since then) but the S&P 500 has climbed higher in that time. We believe the approximately $5 trillion in COVID-related stimulus worked to postpone or push forward the normally-anticipated adverse market reaction to this indicator’s signal. As a reminder, it’s always dangerous to assume “it’s different this time,” i.e. that it’s now safe to ignore this signal. Patience is a virtue….
The other indicator I wanted to show was the relative price of lumber vs. gold:
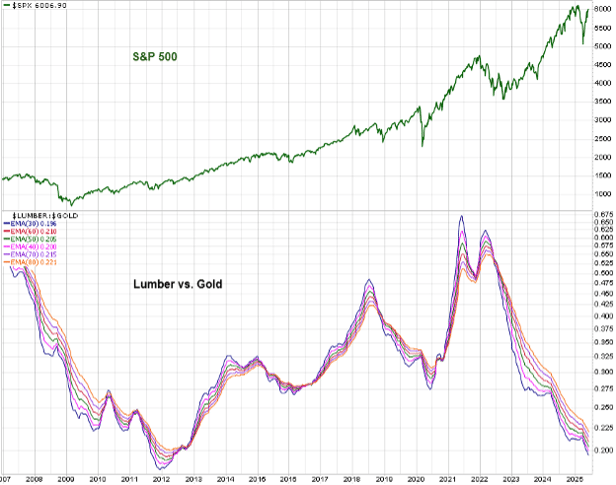
The upper inset in the above chart shows the S&P 500 (green line) and the lower inset shows the relative price of lumber vs. gold. Note that I used several moving averages to represent the relative price of lumber vs. gold, in an effort to smooth the price movements, removing some of the “noise” or excess volatility. In general, for the S&P 500 to be in a healthy bull market, the relative price of lumber vs. gold should likewise be rising or in an ascending trend. For example, when the S&P 500 surged higher from 2012 to 2014, and again from 2016 to 2018, the relative price of lumber vs. gold also surged higher, confirming the strength of the rise in equities.
The rationale supporting this indicator is the price of lumber is very economically sensitive whereas the price of gold is very sensitive to investor sentiment. When the relative price of lumber vs. gold is rising, it’s an indication that the economy is strong as the price of lumber is firm or rising (due to high demand) and also that the price of gold is relatively weak likely due to bullish investor sentiment (gold is desired during bearish investor sentiment).
Since 2022, the relative price of lumber vs. gold has been in a well-defined downtrend, and yet the S&P 500 has moved higher in that time. Is it once again likely due to the $5 trillion in COVID-related stimulus? Or is it truly different this time? Regardless, the fact remains that this indicator has not confirmed the strength or health of the S&P 500’s advance since late 2022.
It’s important to emphasize that we do not arrive at our investment decisions based on just a few indicators, but rather we track many and attempt to discern a cohesive investment thesis based on the confluence of signals from all our indicators & data.
That said we remain defensively positioned in client portfolios as we continue to believe the current environment warrants an emphasis on capital preservation over seeking more speculative sources of returns.
If you have any questions, please feel free to call or email.
The entire team at Measured Wealth wishes to thank you for entrusting us to deliver on your financial goals.
Edward Miller, CFA, CMT
Chief Investment Officer
Measured Wealth Private Client Group
Important Disclosures
Historical data is not a guarantee that any of the events described will occur or that any strategy will be successful. Past performance is not indicative of future results.Returns citied above are from various sources including Factset, Bloomberg, Russell Associates, S&P Dow Jones, MSCI Inc., The St. Louis Federal Reserve and Y-Charts, Inc. The content is developed from sources believed to be providing accurate information. The information in this material is not intended as tax or legal advice. Please consult legal or tax professionals for specific information regarding your individual situation. The opinions expressed and material provided are for general information and should not be considered a solicitation for the purchase or sale of any security. Investing involves risks, including possible loss of principal. Please consider the investment objectives, risks, charges, and expenses of any security carefully before investing.
In order to provide effective management of your account, it is important that we have current information regarding your financial status and circumstances. Please contact us in writing at 303 Islington Street, Portsmouth, NH 03801 if you have any changes in your financial situation or investment objectives, and whether you wish to impose any reasonable restrictions on the management of the account or reasonably modify existing restrictions.
Measured Wealth Private Client Group, LLC is an investment adviser located in Portsmouth, New Hampshire. Measured Wealth Private Client Group, LLC is registered with the Securities and Exchange Commission (SEC). Registration of an investment adviser does not imply any specific level of skill or training and does not constitute an endorsement of the firm by the Commission. Measured Wealth Private Client Group, LLC only transacts business in states in which it is properly registered or is excluded or exempted from registration.
This publication is provided to clients and prospective clients of Measured Wealth Private Client Group, LLC for general informational and educational purposes only. It does not: (i) consider any person's individual needs, objectives, or circumstances; (ii) contain a recommendation, offer, or solicitation to buy or sell securities, or to enter into an agreement for investment advisory services; or (iii) constitute investment advice on which any person should or may rely. Past performance is no indication of future investment results. This publication is based on information obtained from third parties. While Measured Wealth Private Client Group, LLC seeks information from sources it believes to be reliable, Measured Wealth Private Client Group, LLC has not verified, and cannot guarantee the accuracy, timeliness, or completeness, of the third-party information used in preparing this publication. The third-party information and this publication are provided on an “as is” basis without warranty.
This publication may contain forward-looking statements relating to the objectives, opportunities, and the future performance of the U.S. market generally. Forward-looking statements may be identified by the use of such words as; “should,” “estimated,” “potential” and other similar terms. Examples of forward-looking statements include, but are not limited to, estimates with respect to financial condition, results of operations, and success or lack of success of any particular investment strategy. All are subject to various factors, including, but not limited to general and local economic conditions, changing levels of competition within certain industries and markets, changes in interest rates, changes in legislation or regulation, and other economic, competitive, governmental, regulatory and technological factors affecting a portfolio's operations that could cause actual results to differ materially from projected results. Such statements are forward-looking in nature and involve a number of known and unknown risks, uncertainties and other factors, and accordingly, actual results may differ materially from those reflected or contemplated in such forward-looking statements. Prospective investors are cautioned not to place undue reliance on any forward-looking statements or examples. None of Measured Wealth Private Client Group, LLC or any of its affiliates or principals nor any other individual or entity assumes any obligation to update any forward-looking statements as a result of new information, subsequent events or any other circumstances. All statements made herein speak only as of the date that they were made.