Investment Perspective
“
What happens beneath the surface of the market can be just as important as the headline returns.
Like a duck gliding across a still lake while paddling furiously beneath the surface, the stock market’s 3Q results looked healthy at first glance but told quite a different story underneath. The S&P 500 Index gained 2.3% for the quarter, bringing its year-to-date (YTD) return to 12.7%. Below that headline, however, the picture was much weaker: the Russell Midcap Index fell -3.0%, the small-cap Russell 2000 Index dropped -7.2%, and even the equal-weighted S&P 500 ETF (ticker: RSP), which gives every company in the index the same influence, declined -1.9%. The gap between the conventional, cap-weighted S&P 500 Index and nearly everything else is a clear sign that market breadth, or the number of stocks participating in the advance, narrowed significantly during the quarter.
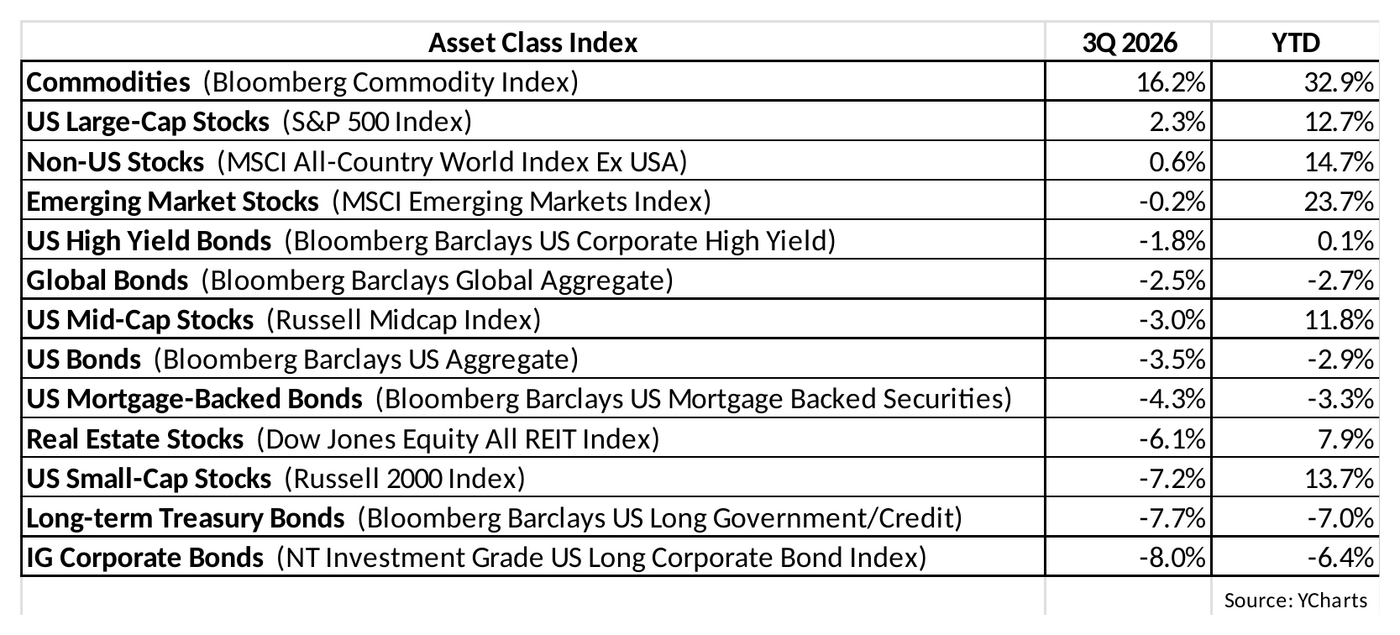
Asset class index returns — 3Q 2026 and year-to-date. Source: YCharts.
A Narrowing Market
The graphic below shows just how concentrated the market’s strength became. Only two of the eleven major equity sectors, technology and energy, finished the quarter trading above their 50-day moving averages.
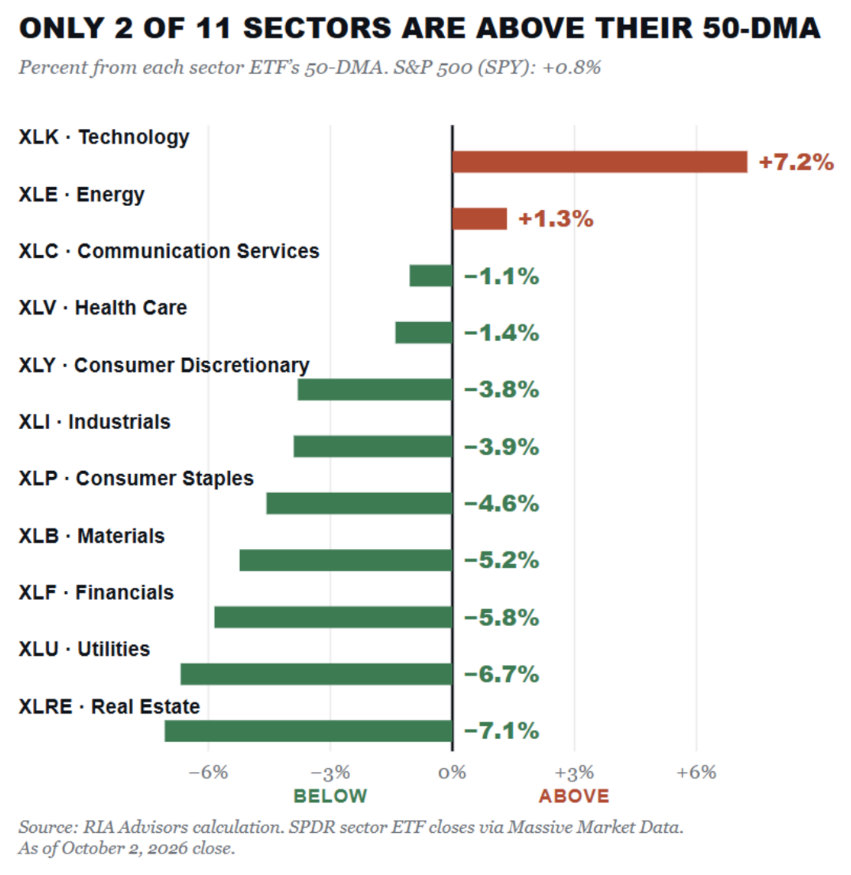
Only 2 of 11 sectors are above their 50-day moving average (percent from each sector ETF's 50-DMA). Source: RIA Advisors calculation; SPDR sector ETF closes via Massive Market Data, as of October 2, 2026 close.
Why does this matter? Because healthy bull markets are typically broad-based, with most sectors trading above key trend lines such as the 50-day and 200-day moving averages. When only a handful of areas are holding up, the market’s foundation is thinner and less robust than the index level suggests, and a rally that depends on fewer leaders is more vulnerable if those leaders stumble.
The equity picture had looked far more encouraging earlier in the year. As the chart below shows, breadth improved steadily through the summer, with the percentage of S&P 500 stocks trading above their 50-day moving average climbing from the mid-40s in May to roughly 70% by late July.
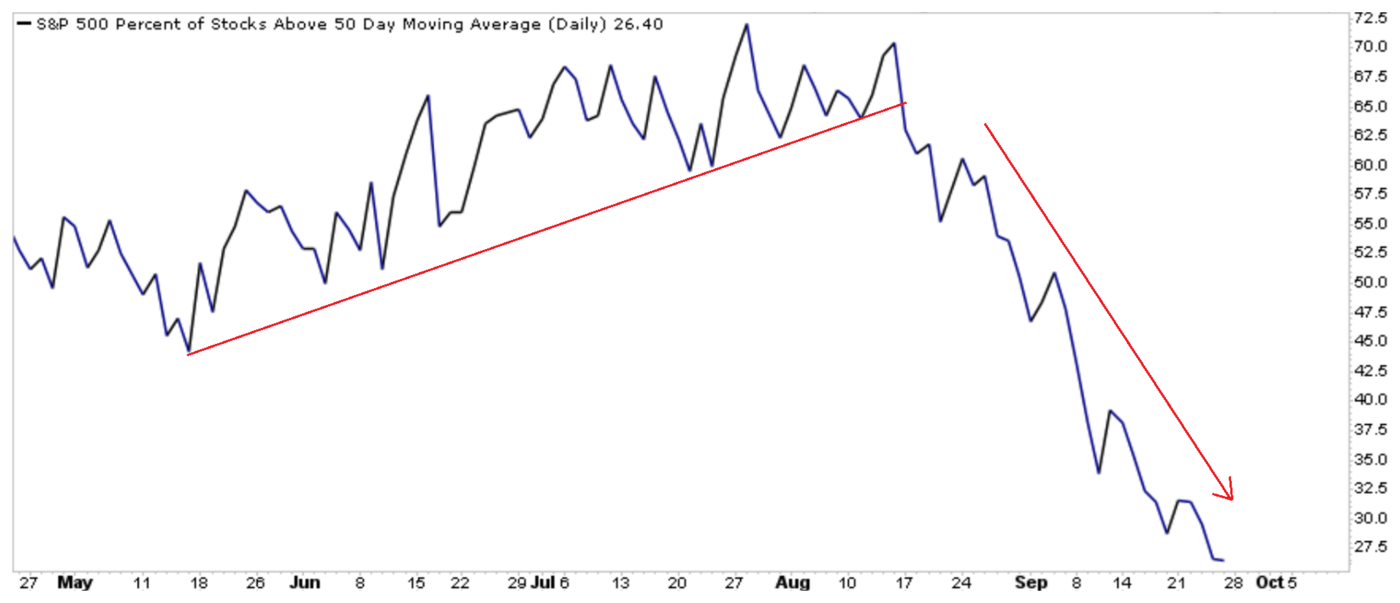
S&P 500 — percent of stocks trading above their 50-day moving average (daily). Source: StockCharts.com (symbol $SPXA50R).
But that progress did not last. Around mid-August the trend reversed abruptly, and the percentage of stocks above their 50-day moving average fell from roughly 70% to near 25% by the end of September. A sharp rise in interest rates is likely a major reason for the deterioration. August inflation data came in hotter than expected, which led investors to raise their expectations for a Fed rate hike in September. Inflation worries were compounded by energy markets, as the price of crude oil surged by nearly 40% from early August to mid-September.
Higher rates tend to weigh most heavily on smaller and mid-sized companies, which often carry more floating-rate debt and have less pricing power than their larger peers. That helps explain why the smaller-cap Russell indices fell so much further than the S&P 500. In fact, last month, the only sector to outperform the S&P 500 was technology, led once again by the mega-cap “Magnificent 7” and other AI-related stocks.
Several developments will help determine whether breadth repairs or deteriorates further, such as the next inflation reading and the Fed’s response, the path of oil prices, and whether market leadership widens beyond technology.
Bonds: Who Needs Them?
Since the COVID pandemic in 2020, investors have watched interest rates head north, with the 10-year Treasury yield rising from well below 1% to about 5.2% currently. That is an enormous move. The primary driver has been inflation, which spiked as pandemic shutdowns disrupted supply chains, creating shortages and pushing prices higher. Inflation has cooled from its 9.1% peak in 2022, but it has stubbornly remained above the Fed’s 2% target, with the most recent reading at 3.4%.
As a result, bonds have taken investors on quite a rollercoaster ride. Since the end of 2018, the bellwether Bloomberg U.S. Aggregate Bond Index, or “Agg,” has ranged from a best annual return of 8.7% in 2019 to a worst of -13% in 2022. That is a wide gap for what is supposed to be the steadier, lower-volatility part of a portfolio, and this year has not offered much relief as the Agg is down -2.9% year to date after losing -3.5% in the third quarter.
Because stocks have climbed while bonds have struggled, the fixed income portion of many portfolios has shrunk over that time. The following exhibit shows what a 60/40 portfolio left alone since the end of 2019 looks like today:
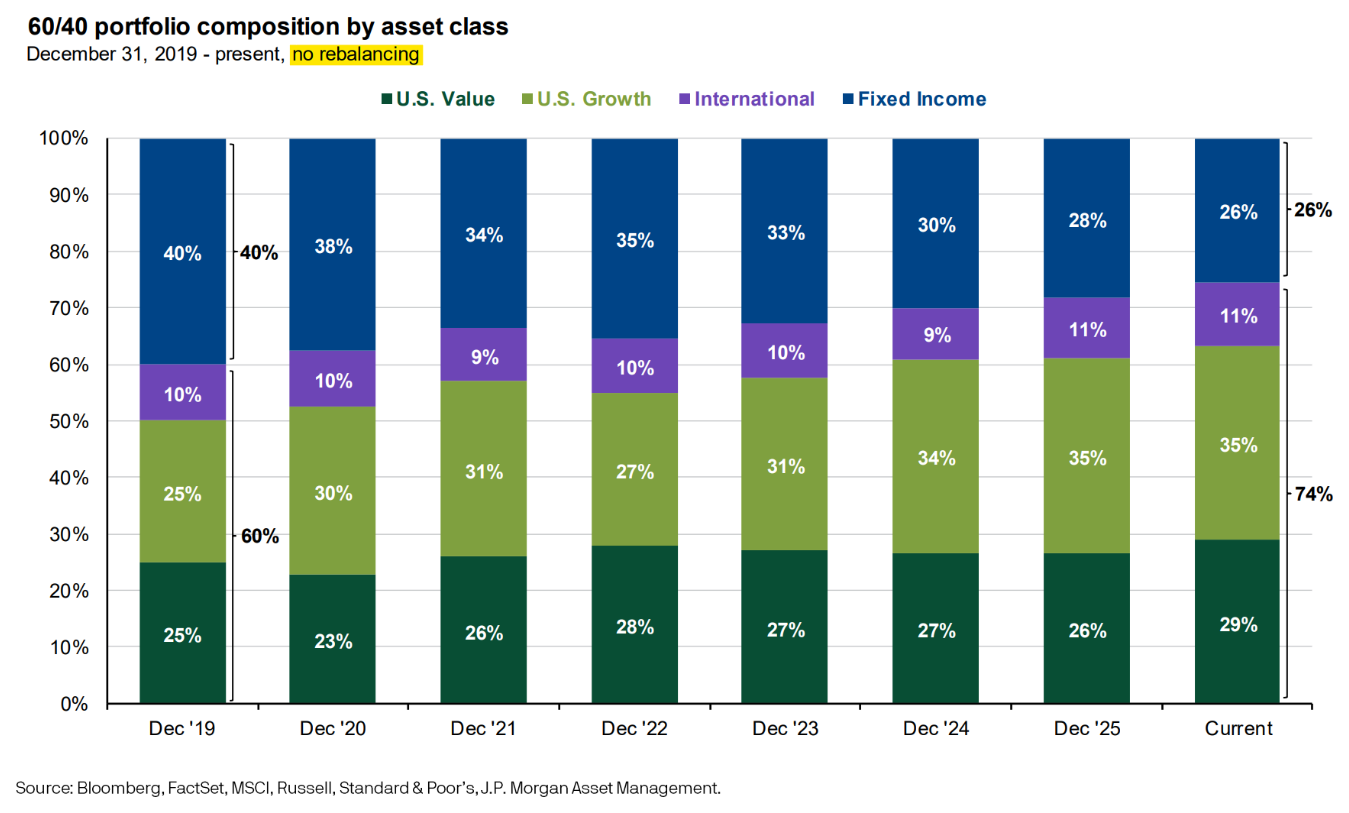
60/40 portfolio composition by asset class, December 31, 2019 to present, with no rebalancing. Source: Bloomberg, FactSet, MSCI, Russell, Standard & Poor's, J.P. Morgan Asset Management.
Without rebalancing, the fixed income allocation of a 60/40 portfolio has drifted from 40% down to 26%, a decline of -14%, while equities have grown to 74% of the portfolio. Rebalancing would have corrected this drift and kept bonds at or near 40%, but the point is made: stocks have performed very well since 2019, especially relative to fixed income. There is also a practical lesson here. A portfolio that has quietly drifted to 74% stocks is taking far more equity risk than its owner may realize, which matters even more in a market this narrow.
Given the upward trajectory of rates, it is natural to ask, “Why do I need bonds in my portfolio? What purpose are they serving?” The purpose of fixed income is to serve as ballast, protecting the portfolio from undue losses when stocks go through periods of volatility. Granted, bonds have also been volatile in recent years, but nothing like what we typically see when stocks undergo corrections. It must be noted, however, that stocks and bonds can decline together, as they did in 2022.
There is also a forward-looking case for bonds. As the following chart illustrates, higher starting yields have historically been followed by higher five-year annualized returns.
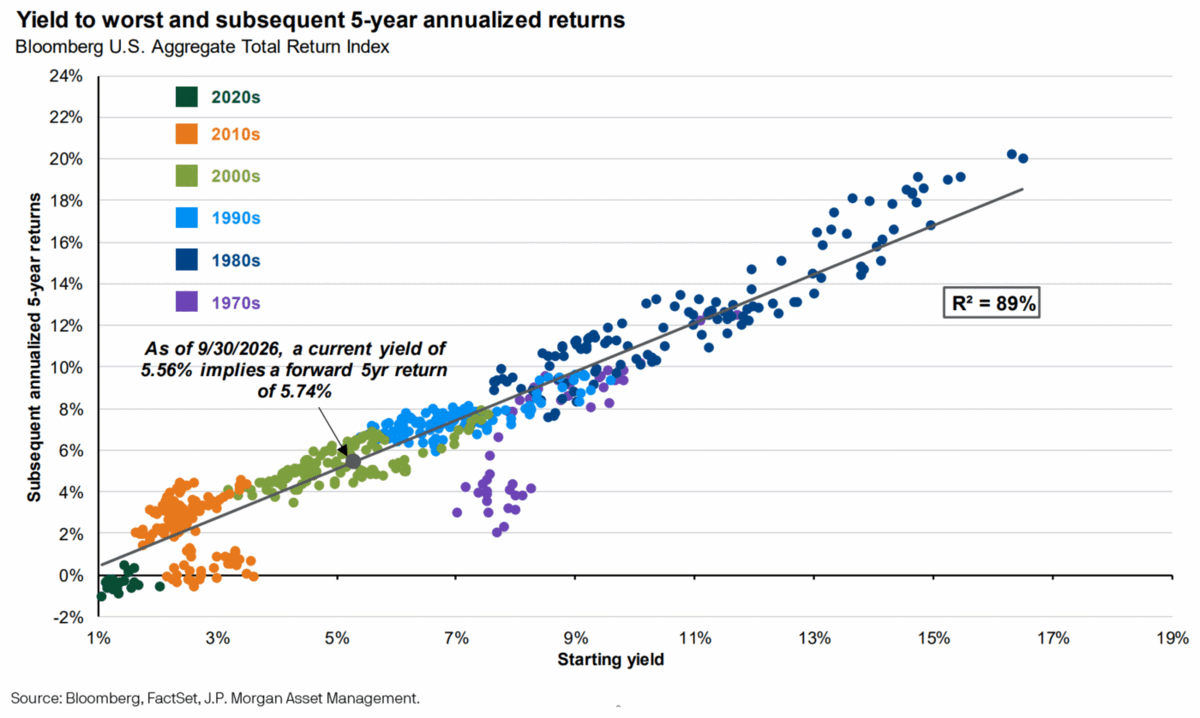
Yield to worst and subsequent 5-year annualized returns — Bloomberg U.S. Aggregate Total Return Index. Source: Bloomberg, FactSet, J.P. Morgan Asset Management.
As of the end of September, the Bloomberg U.S. Aggregate Bond Index yielded about 5.6%, which has historically corresponded to an annualized total return of about 5.7% over the next five years. In short, when you buy bonds at a higher yield, you have historically earned higher returns over the following five years. The statistical regression shown in the chart above plots dots rising from the lower left to the upper right, with each dot representing a yearly starting yield going back to the 1970s. The relationship of starting yield to subsequent 5-year annualized return has an R2 of 89%, which is a statistical term that helps explain how one variable affects or changes another variable. In this case, starting yield explains roughly 89% of the variation in subsequent five-year returns across the data shown.
This regression illustrates a historical pattern, not a prediction or forecast. An R² of 89% is strong but not perfect, so some past periods landed above or below the line, and the future may differ.
It also helps to remember that not all bonds behave alike. This past quarter, long-term Treasuries and long-term investment-grade corporate bonds fell -7.7% and -8.0%, more than twice the loss of the broad Agg index, because longer maturities are more sensitive to rising rates.
Even though fixed income has had a rough go of it over the last few years, reducing your bond holdings because you have lost patience or feel they serve no real purpose can leave your portfolio exposed when conditions change. Interest rates do not rise forever, and acting as if they will could put your portfolio in harm’s way when they eventually change direction. Today’s higher yields have rebuilt the income cushion that bonds lacked for years, and the combination of a narrow stock market and a portfolio that may have drifted toward equities is a good reason to revisit your allocation.
As always, we appreciate the trust you place in our team at Measured Wealth. If your financial goals, retirement plans, or personal circumstances have changed, we encourage you to reach out so we can ensure your investment strategy remains aligned with your objectives.
Thank you for your continued confidence.
Important Disclosures
Measured Wealth Private Client Group, LLC ("Measured Wealth") is an investment adviser located in Rye, New Hampshire, registered with the SEC. Registration does not imply a certain level of skill or training.
This publication is provided to clients and prospective clients for general informational and educational purposes only. It does not consider any person's individual needs or circumstances and is not investment, tax, or legal advice, or a recommendation, offer, or solicitation to buy or sell any security or to enter into an advisory agreement. Please consult your tax or legal professional regarding your individual situation.
Individual securities (including the "Magnificent 7," a market term), indices, and exchange-traded funds, and their returns, are shown for illustrative purposes only, to demonstrate recent market trends. They are not presented as Measured Wealth portfolio holdings or recommendations, and do not represent the past or current performance of any Measured Wealth strategy. Measured Wealth clients may hold positions in securities discussed, and Measured Wealth may buy or sell them at any time. Indices are unmanaged and cannot be invested in directly.
Data is drawn from third-party sources, including FactSet, Bloomberg, Russell, S&P Dow Jones Indices, MSCI, the Federal Reserve Bank of St. Louis, and YCharts, that Measured Wealth believes to be reliable but has not independently verified and cannot guarantee as to accuracy, timeliness, or completeness.
Investing involves risk, including possible loss of principal. Past performance and historical data do not guarantee future results or that any strategy will be successful.
This commentary contains forward-looking statements, including views on markets, economic conditions, and investment strategies. These statements reflect our judgment as of the date of publication, are subject to change without notice, and involve known and unknown risks and uncertainties, including changes in economic conditions, interest rates, and regulation, that could cause actual results to differ materially. Readers should not place undue reliance on them. Measured Wealth undertakes no obligation to update any forward-looking statement.
Please contact us if there have been any changes in your financial situation or investment objectives, or if you wish to impose any reasonable restrictions on the management of your account or reasonably modify existing restrictions.