In light of recent stock market activity, we wanted to take the opportunity to comment and relay our thoughts. As of this writing, the S&P 500 is down nearly -4%, the Nasdaq 100 is down about -5% and the Russell 2000 is down about -7% since market open 8/1/2024. A weak jobs report has scared investors as the prospect of a recession becomes a real concern.
Not surprisingly, the best-performing sectors during this period are defensive: utilities, REITs, health care, and consumer staples. The worst-performing sector is technology.
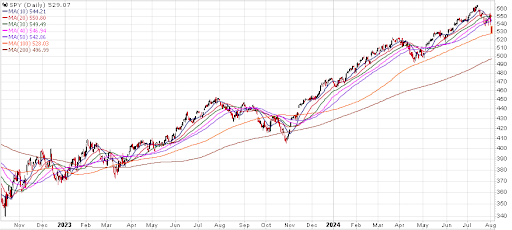
As this daily chart of the S&P 500 shows, this recent decline is just a blip right now:

Given the uptrend, it’s likely that this recent decline will reverse & rally at some point next week before further declines possibly occur.
The key takeaway is that after such a sustained uptrend, markets do not typically reverse and undergo an abruptly severe downturn. Rather, the snap-back rallies often occur as the extreme bullish sentiment remains and needs to be gradually worked off or pierced.
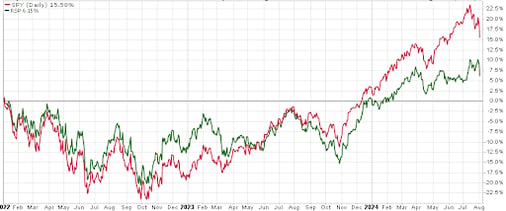
The following chart shows performance for the S&P 500 (red line) and the equal-weight S&P 500 (RSP, green line) since the start of 2022:

It took about two years from the start of 2022 for the S&P 500 and RSP to get back to breakeven. The gains so far this year have come with the cap-weighted S&P 500 further distancing itself from the equal-weight S&P 500.
The following chart shows a momentum indicator in the upper inset and the S&P 500 (red line) in lower inset:
.png?width=512&height=376&name=unnamed%20(5).png)
When the momentum indicator has reached the 1.9 level or higher (orange horizontal line), it’s a sign that the market has become extremely overbought or overheated. Note the yellow highlighted areas on the S&P 500 (red line) marking these extreme overbought periods. Typically, meaningful equity corrections have followed.
Another reason to expect a more significant correction from here is seasonality; historically, August-September has been the worst two-month period for the market.
Finally, when the Fed starts cutting rates after a prolonged period of raising rates, the S&P 500 (stocks) tend to decline. The stimulative effect of the rate cuts tends to get overwhelmed by the growing fear in investors, as they sell stocks in response to concerns about a recession (not knowing if will be mild or deep). The orange line in the chart below is the 2-year government bond yield, which as you can see tends to lead the Fed Funds rate (black line). When the 2-year bond yield is lower than the Fed Funds rate, as it has been for months, that’s typically not good for stocks, as evidenced by the green line (S&P 500).
.png?width=512&height=217&name=unnamed%20(6).png)
As always, if you have any questions, please contact us. The entire team at Measured Wealth wishes to thank you for entrusting us to deliver on your financial goals.
Edward Miller, CFA, CMT
Chief Investment Officer
Measured Wealth Private Client Group
Important Disclosures
Historical data is not a guarantee that any of the events described will occur or that any strategy will be successful. Past performance is not indicative of future results.
Returns citied above are from various sources including Bloomberg, Russell Associates, S&P Dow Jones, MSCI Inc., The St. Louis Federal Reserve and Y-Charts, Inc. The content is developed from sources believed to be providing accurate information. The information in this material is not intended as tax or legal advice. Please consult legal or tax professionals for specific information regarding your individual situation. The opinions expressed and material provided are for general information and should not be considered a solicitation for the purchase or sale of any security. Investing involves risks, including possible loss of principal. Please consider the investment objectives, risks, charges, and expenses of any security carefully before investing.
In order to provide effective management of your account, it is important that we have current information regarding your financial status and circumstances. Please contact us in writing at 303 Islington Street, Portsmouth, NH 03801 if you have any changes in your financial situation or investment objectives, and whether you wish to impose any reasonable restrictions on the management of the account or reasonably modify existing restrictions.
Measured Wealth Private Client Group, LLC is an investment adviser located in Portsmouth, New Hampshire. Measured Wealth Private Client Group, LLC is registered with the Securities and Exchange Commission (SEC). Registration of an investment adviser does not imply any specific level of skill or training and does not constitute an endorsement of the firm by the Commission. Measured Wealth Private Client Group, LLC only transacts business in states in which it is properly registered or is excluded or exempted from registration.
This publication is provided to clients and prospective clients of Measured Wealth Private Client Group, LLC for general informational and educational purposes only. It does not: (i) consider any person's individual needs, objectives, or circumstances; (ii) contain a recommendation, offer, or solicitation to buy or sell securities, or to enter into an agreement for investment advisory services; or (iii) constitute investment advice on which any person should or may rely. Past performance is no indication of future investment results. This publication is based on information obtained from third parties. While Measured Wealth Private Client Group, LLC seeks information from sources it believes to be reliable, Measured Wealth Private Client Group, LLC has not verified, and cannot guarantee the accuracy, timeliness, or completeness, of the third-party information used in preparing this publication. The third-party information and this publication are provided on an “as is” basis without warranty.
This publication may contain forward-looking statements relating to the objectives, opportunities, and the future performance of the U.S. market generally. Forward-looking statements may be identified by the use of such words as; “should,” “estimated,” “potential” and other similar terms. Examples of forward-looking statements include, but are not limited to, estimates with respect to financial condition, results of operations, and success or lack of success of any particular investment strategy. All are subject to various factors, including, but not limited to general and local economic conditions, changing levels of competition within certain industries and markets, changes in interest rates, changes in legislation or regulation, and other economic, competitive, governmental, regulatory and technological factors affecting a portfolio's operations that could cause actual results to differ materially from projected results. Such statements are forward-looking in nature and involve a number of known and unknown risks, uncertainties and other factors, and accordingly, actual results may differ materially from those reflected or contemplated in such forward-looking statements. Prospective investors are cautioned not to place undue reliance on any forward-looking statements or examples. None of Measured Wealth Private Client Group, LLC or any of its affiliates or principals nor any other individual or entity assumes any obligation to update any forward-looking statements as a result of new information, subsequent events or any other circumstances. All statements made herein speak only as of the date that they were made.


.png?width=512&height=376&name=unnamed%20(5).png)
.png?width=512&height=217&name=unnamed%20(6).png)


