By Edward Miller, CFA®, CMT®
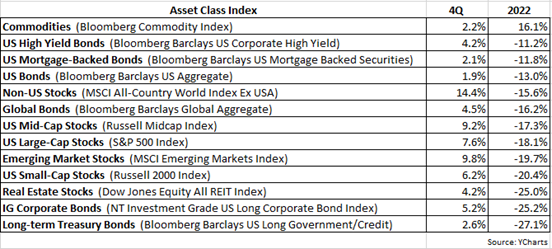
Most investors were very glad to see 2022 come to a close. Whereas 2021 was an excellent year for US equities with the S&P 500 Index posting a 28.7% total return, such good fortune abruptly took a turn for the worse in 2022. The S&P 500 finished last year down -18.1%, but this popular index wasn’t alone as most global equity markets suffered losses. Two primary examples are the MSCI All-Country World Index Excluding USA, which was down -15.6% in 2022, and the MSCI Emerging Markets Index, which closed out last year in the red by nearly -20%.
What made matters worse for investors last year was the extremely disappointing performance of fixed income investments. In fact, for bonds in general, it was the worst annual return on record, going back 250 years! Typically, the fixed income allocation in a client’s portfolio is expected to serve as a ballast, helping to cushion or buoy the portfolio when equity market volatility increases. But that tempering effect was seemingly nonexistent in 2022 as evidenced by the bellwether Bloomberg Barclays US Aggregate Index declining by -13%, by far its worst return since its inception in 1976. The previous worst year for this Index was 1994 with a return of -2.9%, a relatively modest decline when compared to last year’s double-digit slide.
It's exceedingly rare to have both equities and bonds suffer double-digit losses at the same time. The following graphic helps illustrate this fact.
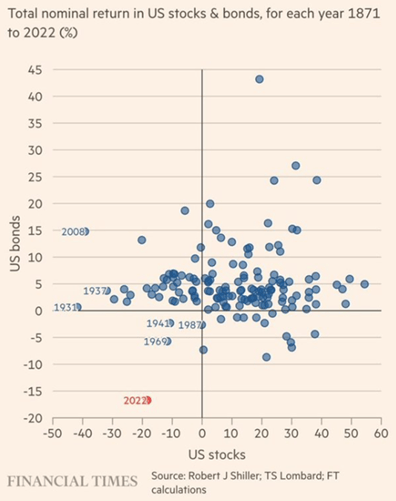
As shown above, the X-axis displays a range of returns for US equities and the Y-axis does the same for US bonds. The dots represent annual returns for both US stocks and bonds dating back to 1871. Notice that most of the dots tend to congregate in the upper-right quadrant, which is where both stocks & bonds have positive returns. The lower-left quadrant contains yearly returns when both stocks and bonds were negative. Very few dots reside in this lower-left quadrant because as we mentioned, it’s quite rare for both stocks and bonds to suffer negative returns in the same year. And yet the red dot for 2022 stands out as an extreme outlier since it’s the only year since 1872 that registered double-digit losses for both stocks and bonds.
Another way of showing this very rare but painful investment outcome is displayed in the next chart.
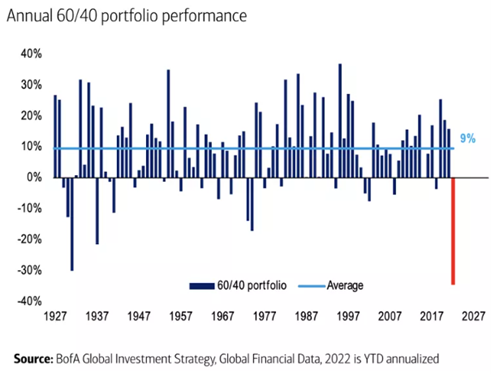
Shown above are the returns for a generic 60/40 portfolio dating back to 1920. The red bar is the return for a 60/40 portfolio last year, which was the worst annual return for a 60/40 portfolio in the past 100 years.
Fortunately, last year we had client portfolios positioned defensively, overweighting areas such as higher dividend-yielding stocks, gold and lower volatility sectors such as consumer staples and utilities. In late 2021, our investment process was strongly urging that it was time to get cautious, and in our 4Q 2021 client letter we wrote that 2022 would likely see market volatility increase as the Fed aggressively raised interest rates in hopes of subduing high inflation. And indeed that is what occurred, market volatility picked up significantly as the Fed raised rates seven times last year, causing the 10-year Treasury yield to surge from approximately 1.7% at the start of the year to a peak of 4.2% by October.
What do we expect for 2023? As I wrote in the 4Q 2021 client letter:
With the advent of a new year, we can expect to see the usual deluge of market outlooks and annual forecasts from Wall Street strategists. And at this time I always recall more than one such strategist privately confessing that he/she hated putting together these outlooks, admitting it was more or less educated guesswork trying to predict what would happen during the year, but that they were pressured to do so because clients expected it. In fact, a good argument can be made that it’s easier to predict what will happen either next week or in ten years than it is to forecast what will occur in the next twelve months.
But as we did in last year’s 4Q letter, we’ll venture to make a few educated guesses about what could transpire in 2023. For one, a recession is very likely, regrettably. Over the last few months, several economic indicators with very good track records for predicting recessions have turned negative. As an example, the Conference Board Leading Economic Indicator (LEI) turned negative late last year (as shown in the chart below).
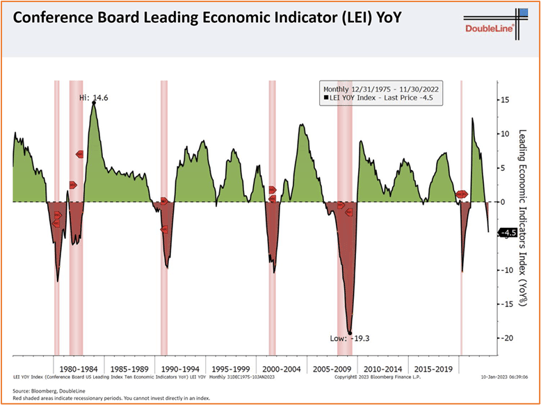
In the past, when the LEI has become this negative or worse, a recession has resulted (as indicated in the chart by the pink shaded areas).
This next graphic lists 12 economic variables that historically have been prescient in forecasting recessions.
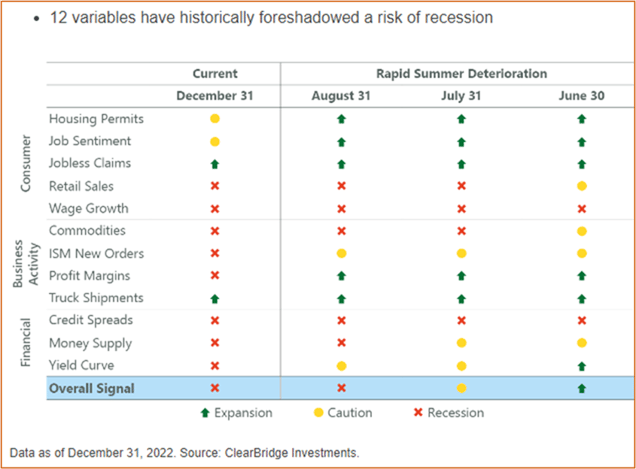
Last June, the overall signal based on these 12 variables remained positive, as indicated by the green arrow. However, by July the overall signal had turned cautious yellow, and in August the overall signal turned red and it has remained red, suggesting a recession in the near future is very probable.
Although a recession is typically associated with grim, depressing connotations, one good outcome that can stem from an economic slowdown is inflation usually declines. In fact, late last year we already started to see signs of inflation peaking and heading south. By raising interest rates, the Fed aimed to cool the economy by reducing demand and thereby bringing down inflation. The Fed’s ultimate goal is a “soft landing” for the economy, which means the economy slows enough to significantly relieve inflationary pressures without involving a meaningful rise in unemployment. This “Goldilocks” scenario has always been extremely elusive for the Fed to engineer as it typically overshoots with interest rate hikes. Yet investors are currently grappling with odds that this time around the Fed might finally be successful in this endeavor.
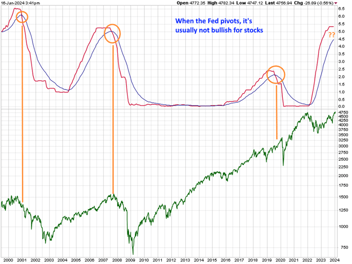
With a recession looming, or even just a mild economic slowdown, we do expect inflation to continue receding and in response, the Fed should temper or even halt rate hikes. A shift from a hawkish to more dovish stance by the Fed would be bullish for bonds. Frankly, it would not surprise us if on the heels of one of the worst years ever for fixed income, that bonds reverse course and experience a very good 2023. While our view on equities remains defensive, depending on how matters unfold this year, our stance could change fairly quickly to more bullish. It’s worth reminding that the stock market is a massive discounting mechanism, with prices constantly adjusting to perceived outcomes 6-12 months into the future. For this reason, equities could rise even though financial news and economic datapoints may be dour or discouraging at the time.
Lastly, to end this letter on an uplifting note, we offer the following chart:
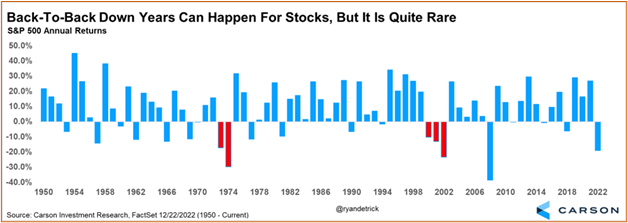
While consecutive negative yearly returns for stocks are certainly possible, as shown above, it’s rare for that to happen.
As always, if you have any questions, please feel free to call or email. The entire team at Measured Wealth wishes you all the best during this new year.

Ed Miller, CFA, CMT
Chief Investment Officer
Measured Wealth Private Client Group
Important Disclosures
Historical data is not a guarantee that any of the events described will occur or that any strategy will be successful. Past performance is not indicative of future results.
Returns citied above are from various sources including Factset, Bloomberg, Russell Associates, S&P Dow Jones, MSCI Inc., The St. Louis Federal Reserve and Y-Charts, Inc. The content is developed from sources believed to be providing accurate information. The information in this material is not intended as tax or legal advice. Please consult legal or tax professionals for specific information regarding your individual situation. The opinions expressed and material provided are for general information and should not be considered a solicitation for the purchase or sale of any security. Investing involves risks, including possible loss of principal. Please consider the investment objectives, risks, charges, and expenses of any security carefully before investing.
In order to provide effective management of your account, it is important that we have current information regarding your financial status and circumstances. Please contact us in writing at 303 Islington Street, Portsmouth, NH 03801 if you have any changes in your financial situation or investment objectives, and whether you wish to impose any reasonable restrictions on the management of the account or reasonably modify existing restrictions.
Measured Wealth Private Client Group, LLC is an investment adviser located in Portsmouth, New Hampshire. Measured Wealth Private Client Group, LLC is registered with the Securities and Exchange Commission (SEC). Registration of an investment adviser does not imply any specific level of skill or training and does not constitute an endorsement of the firm by the Commission. Measured Wealth Private Client Group, LLC only transacts business in states in which it is properly registered or is excluded or exempted from registration.
This publication is provided to clients and prospective clients of Measured Wealth Private Client Group, LLC for general informational and educational purposes only. It does not: (i) consider any person's individual needs, objectives, or circumstances; (ii) contain a recommendation, offer, or solicitation to buy or sell securities, or to enter into an agreement for investment advisory services; or (iii) constitute investment advice on which any person should or may rely. Past performance is no indication of future investment results. This publication is based on information obtained from third parties. While Measured Wealth Private Client Group, LLC seeks information from sources it believes to be reliable, Measured Wealth Private Client Group, LLC has not verified, and cannot guarantee the accuracy, timeliness, or completeness, of the third-party information used in preparing this publication. The third-party information and this publication are provided on an “as is” basis without warranty.
This publication may contain forward-looking statements relating to the objectives, opportunities, and the future performance of the U.S. market generally. Forward-looking statements may be identified by the use of such words as; “should,” “estimated,” “potential” and other similar terms. Examples of forward-looking statements include, but are not limited to, estimates with respect to financial condition, results of operations, and success or lack of success of any particular investment strategy. All are subject to various factors, including, but not limited to general and local economic conditions, changing levels of competition within certain industries and markets, changes in interest rates, changes in legislation or regulation, and other economic, competitive, governmental, regulatory and technological factors affecting a portfolio's operations that could cause actual results to differ materially from projected results. Such statements are forward-looking in nature and involve a number of known and unknown risks, uncertainties and other factors, and accordingly, actual results may differ materially from those reflected or contemplated in such forward-looking statements. Prospective investors are cautioned not to place undue reliance on any forward-looking statements or examples. None of Measured Wealth Private Client Group, LLC or any of its affiliates or principals nor any other individual or entity assumes any obligation to update any forward-looking statements as a result of new information, subsequent events or any other circumstances. All statements made herein speak only as of the date that they were made.