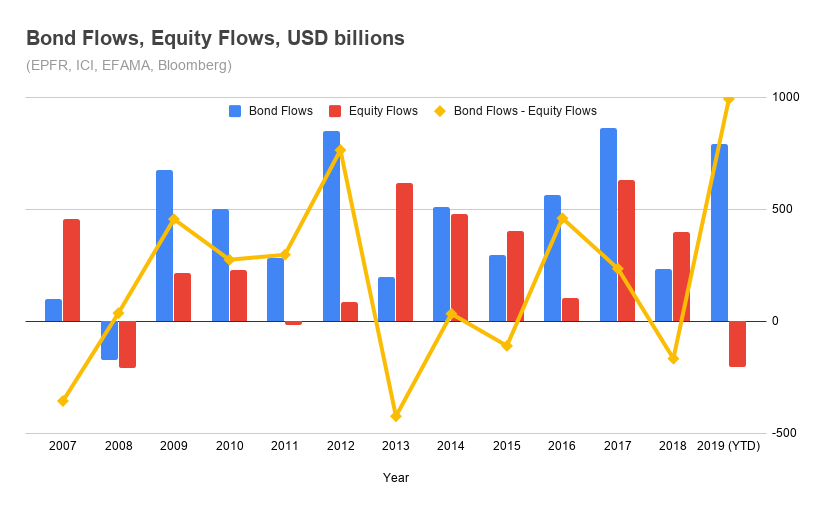
If someone had told you on January 1st 2019 that the year would start off with fears of an economic recession in the US as Retail Sales showed their largest decline since 2009, and then that the US would be in a trade war with China where at one point the President ordered all US companies to start looking for an alternative to doing business in that country, you would have thought that 2019 would likely end up being a pretty volatile year. As if these two headwinds weren’t enough, add to them that the President would have been impeached towards year-end, and you may have even asked, “How bad was the bear market going to be?” Investors indeed “voted with their feet” as net flows into equity funds were negative for the first time since 2011 and dwarfed by the rush into bond funds.
But instead, we’ve just completed a year in which the S & P 500® rose 9.0% during the fourth quarter and 31.5% for 2019. Coming off last year’s 20% decline in the fourth quarter, this year was indeed much less volatile with the largest decline confined to -7%.
Source: Standard & Poor’s
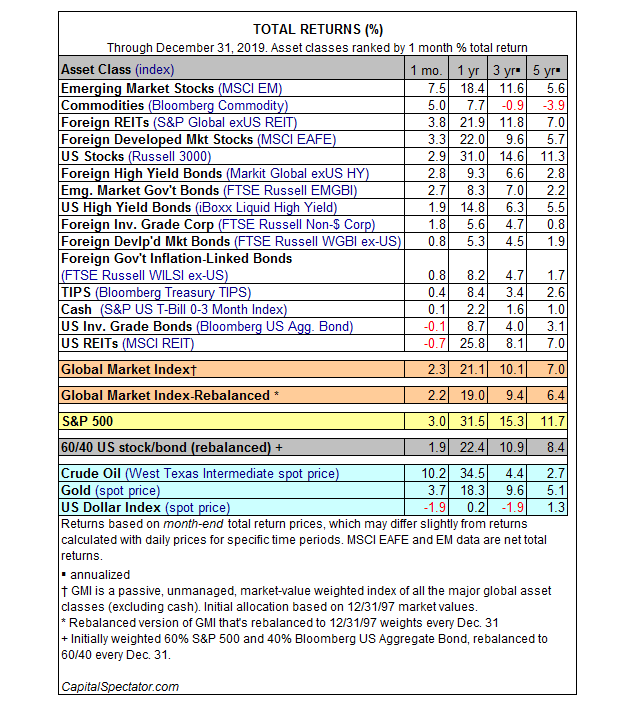
Bonds were flat to down during the quarter with the Bloomberg Barclay’s US Aggregate Index® returning 0.2% for the quarter and 8.7% for the year. Large Cap Growth outperformed all other segments and ended up 11.2% for the quarter and over 36% for the year. Small Cap Value was up 8.4% for the quarter and “only” up 22% for the year. Non-US stocks joined the party as well rising 7.7% for the quarter and 22% for 2019 as measured by the MSCI EAFE index. Emerging markets too have shown signs of life increasing 12.1% during the fourth quarter and returning 18% for the year as measured by the MSCI Emerging Markets index. Returns for various other asset classes can be found in the table below:
After such a stellar year, how do we see 2020 shaping up? At Measured Wealth, we look at several valuation measures to determine the attractiveness of US equities. One of our main metrics is a variation on the Shiller Cyclically Adjusted P/E ratio or CAPE. The CAPE ratio is a valuation measure that uses real earnings per share (EPS) over a 10-year period to smooth out fluctuations in corporate profits that occur over different periods of a business cycle. The CAPE ratio was popularized by Yale University professor Robert Shiller and is also known as the Shiller P/E ratio. Professor Shiller’s work on the CAPE became famous when he called the top of the ’99 Internet Bubble based on his CAPE work – saying that the market hadn’t been as overvalued anytime since the 1929 crash. Professor Robert Shiller was one of three people to win the 2013 Sveriges Riksbank Prize in Economic Sciences (also known as the Nobel Prize in Economics).
A company’s profitability is determined to a significant extent by various economic cycle influences. During expansions, profits rise substantially as consumers spend more money, but during recessions, consumers buy less, profits plunge and can turn into losses. While profit swings are much larger for companies in cyclical sectors—such as commodities and financials—than they are for firms in defensive sectors such as utilities and pharmaceuticals, few companies can maintain steadfast profitability in the face of a deep recession. Because volatility in per-share earnings also results in price-earnings (P/E) ratios that bounce around significantly, Benjamin Graham and David Dodd recommended in their seminal 1934 book, Security Analysis, that for examining valuation ratios, one should use an average of earnings over preferably seven or ten years.
The cyclically adjusted price-to-earnings (CAPE) ratio initially came into the spotlight in December 1996, after Robert Shiller and John Campbell presented research to the Federal Reserve that suggested stock prices were running up much faster than earnings. In the winter of 1998, Shiller and Campbell published their groundbreaking article "Valuation Ratios and the Long-Run Stock Market Outlook," in which they smoothed earnings for the S&P 500 by taking an average of real earnings over the past 10 years, going back to 1872. This ratio was at a record 28 in January 1997, with the only other instance (at that time) of a comparably high ratio occurring in 1929. Shiller and Campbell asserted the ratio was predicting that the real value of the market would be 40% lower in ten years than it was at that time.
While we agree with the basic tenets of the CAPE methodology, we prefer to compare P/E measures over long periods of time to interest rates as it is well-accepted that interest rates are a key determinant of aggregate P/E levels. To do so, we turn P/E’s on their heads and look at the earnings to price ratio or earnings yield (E/P) which allows us to directly compare equity valuations to the current level of interest rates – in our case – the 10yr Treasury Bond. Remember, when looking at valuation this way, higher is better – same as dividend yield.
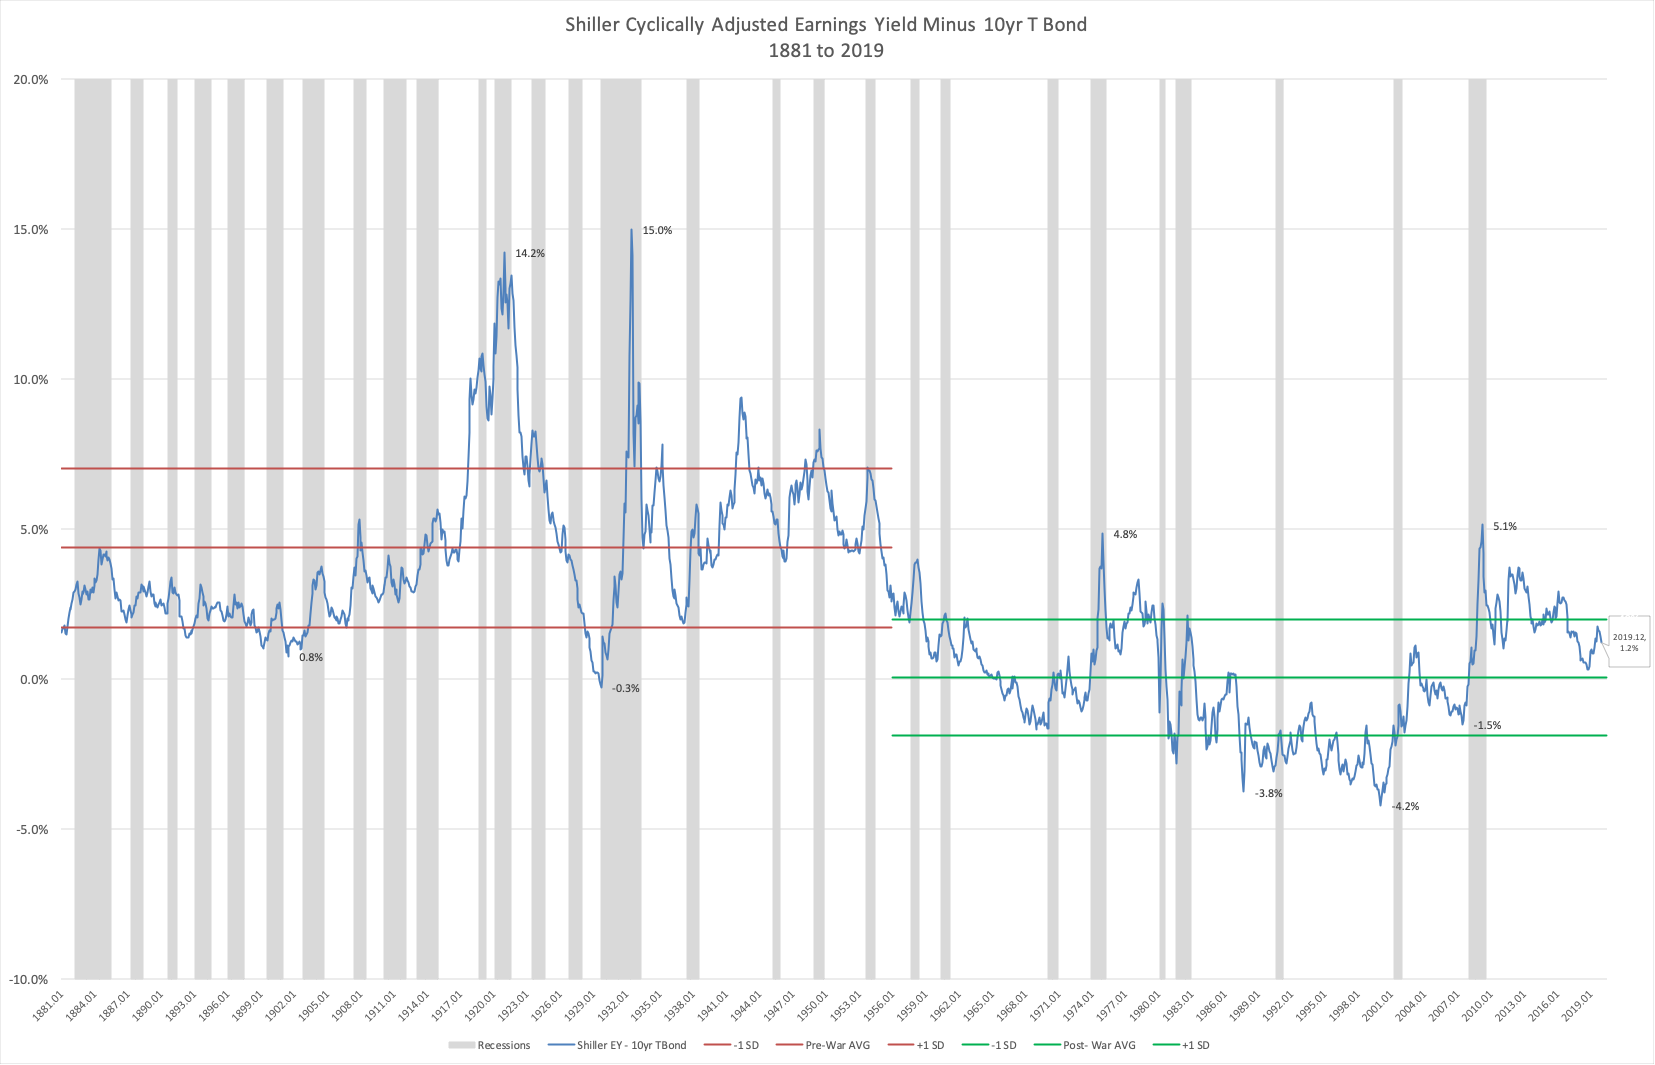
Source: MWPCG, Yale University, Federal Reserve Bank of St. Louis
As you can see from the chart above, the addition of interest rates does not change Shiller’s original conclusion regarding the 1999 bubble and correctly recognizes the 1987 and 1929 market peaks and the 1920, 1932, 1974 and 2010 market bottoms. Here we have 140 years of market history – which includes booms, busts, wars, recessions and depressions. Two things stand out: (1) the US economy has become less volatile over time as evidenced by the number and length of recessions (gray bars) being down significantly during this period; and (2) as a result, average valuations have gone up (yields have gone down). To recognize these changes, we break the analysis into two periods – Pre-World War II and Post-World War II.
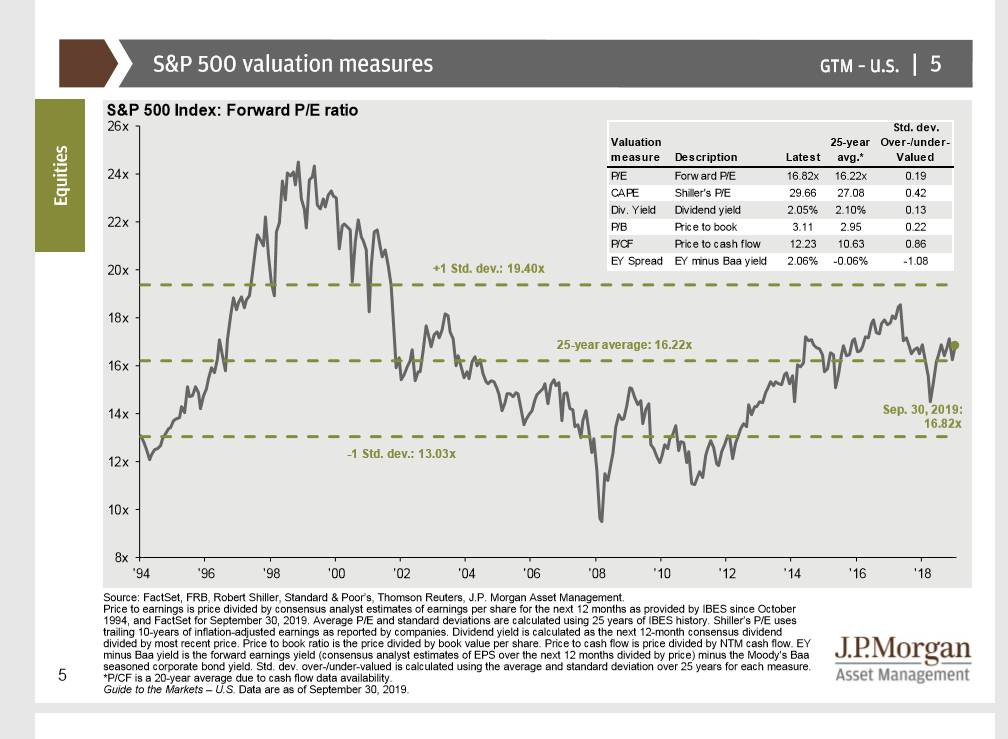
So, what are we trying to say? Bearing in mind that we’ve completed the first decade in US history without a recession, we remain comfortable despite the strong market returns last year with the valuation underpinnings of the US Equity market. Lest you think we only have this measure supporting our thesis – here is a chart from JP Morgan that uses 5 other valuation measures that tell the same story.
In terms of interest rates, we think rates bottomed in the Aug-Sep time frame and the path of least resistance for rates is up for 2020. The graphic below helps to tell the story with our outlook most closely aligned with that of Goldman Sachs.
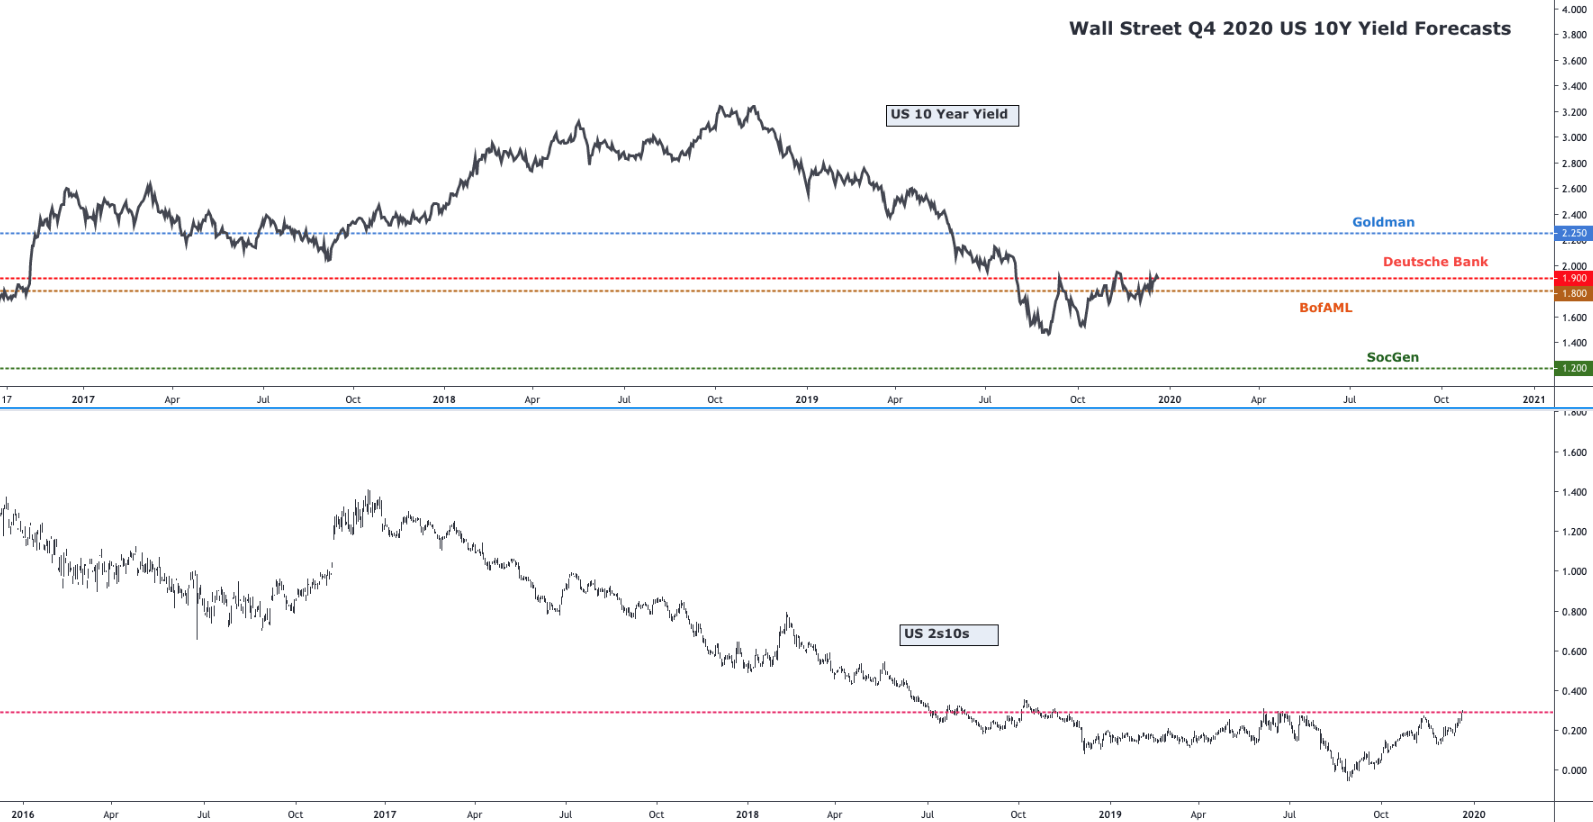
Source: St. Louis Federal Reserve, Goldman Sachs, Deutsche Bank, Bank of America, SoGen
Note: Horizontal axis shows slightly different time periods because of forecast nature of top panel
We believe your portfolios remain positioned to benefit from the outlook described above. The team at Measured Wealth wish you a happy and prosperous New Year. As always, please contact us with any questions.
Steve Bruno, CFA
Chief Investment Officer
January 2, 2020
Disclaimer: Historical data is not a guarantee that any of the events described will occur or that any strategy will be successful. Past performance is not indicative of future results.
Returns citied above are from various sources including Bloomberg, Russell Associates, S&P Dow Jones, MSCI Inc., The St. Louis Federal Reserve and Y Charts, Inc.