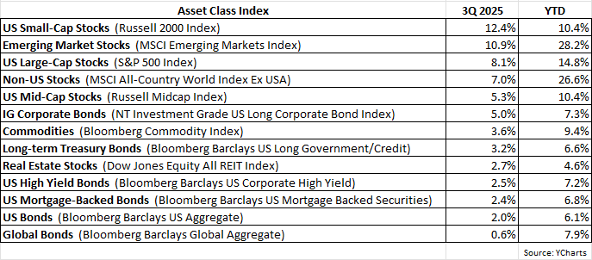
Following a strong Q2, Q3 saw a continuation of gains in both equity and fixed income markets. Stocks maintained their positive momentum since the April 8th low with the S&P 500 Index posting a healthy 8.1% return in the quarter and up nearly 15% YTD. After lagging their large-cap brethren for 2+ years, small-cap stocks surged in the 3Q as the Russell 2000 Index returned 12.4%. Not to be outdone, non-US equities added on to their sterling performance for the year, highlighted by the MSCI Emerging Markets Index rising 10.9% in the quarter, boosting its YTD return to an eye-opening 28.2%.
Bonds have likewise joined the party as most fixed income vehicles continue to respond positively to waning interest rate levels. The Barclays US Aggregate Bond Index gained 2.0% in the quarter and is up a very respectable 6.1% YTD. As expected, the Fed cut rates by 25 basis points in September, indicating a shift towards a more accommodative or dovish monetary policy stance. Although inflation has remained modestly above the Fed’s target of 2%, the employment picture appears to be worsening as hiring activity has slowed down considerably. It appears at this point the Fed is more concerned with unemployment rising in the face of moderating economic growth than fears of price inflation reigniting in earnest.
Are We in a New Bull Market
As US equity markets hit new all-time highs, we increasingly see headlines and articles suggesting that we’ve entered a new bull market. Is that true? Needless to say, we’re in a bull market for stocks, but is it new and just the start of what could be years of future robust gains? Or are we instead perhaps in the late innings of what has been a prolonged advance for US equities, dating back as far as early 2009? We would argue the latter is more likely, that what we’re witnessing is more akin to the late stages of a bull market, which typically involves valuations getting stretched to the extreme and growth expectations becoming unrealistic due to wildly optimistic assumptions. Yes, it really could be different this time, but it rarely if ever is – and in the meantime, markets can indeed shoot higher and defy rational reasoning longer than thought possible. After all, a wise person once said, “It’s the stock market’s job to make the most people wrong most of the time.”
What follows are several charts that help make the case that if anything, the current investment landscape does not appear to be what is typically in place when new bull markets are born.
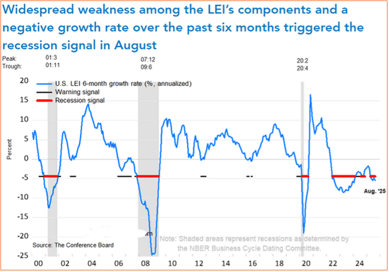
With respect to the US economy, the chart above shows the Leading Economic Index (LEI), which is a composite of ten leading economic indicators that serves as a forecasting tool for business cycle turning points. Historically, the LEI has a very good track record for predicting recessions. When the 6-month growth rate (annualized) of the LEI has declined by -5% or worse, a recession has usually occurred not long after. Such “recession signals” are shown in the chart, when the blue line descends to the red horizontal bars (grey shaded areas = recessions). Note that the blue LEI line has triggered the red recession signal level for approximately the last three years – and still no recession (yet?). But typically new bull markets emerge after a recession, not before or when proven signals suggest a recession is imminent.
Another economy-related chart that appears bearish is the unemployment rate.
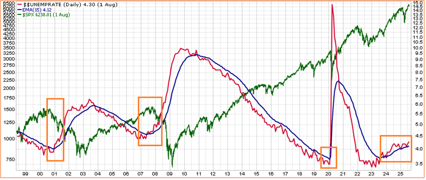
I’ve shown the above chart in past investment letters. The red line is the unemployment rate, the blue line is a moving average of the unemployment rate, and the green line is the S&P 500. When the unemployment rate (red line) rises above its moving average (blue line), the S&P 500 has tended to suffer significant declines. The unemployment rate has been above its moving average since late 2023 and that remains the case currently – yet the S&P 500 is hitting all-time highs. But again, new bull markets usually don’t emerge when the unemployment rate is rising and in an uptrend.
The next chart depicts an indicator that measures investor sentiment.
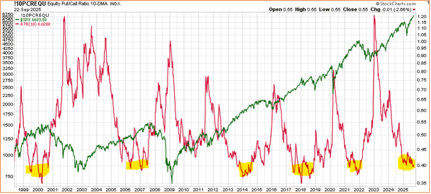
The red line in the above chart represents the put/call ratio, which is an options market indicator that reflects investor sentiment. When the put/call ratio is elevated, it means that investors are worried and getting bearish as they’re buying more puts in relation to calls. But when the put/call ratio is very low (as it is currently), it means that investors are very optimistic as they’re buying more calls than puts. It’s important to realize that sentiment indicators (like the put/call ratio) are typically contrarian indicators, i.e. it’s best to do the opposite of its signal. Note the yellow highlights in the above chart, denoting periods when the put/call ratio was very low, inferring extremely bullish investor sentiment. In almost every yellow-highlighted instance, the S&P 500 (green line) was quite far along in its bull market cycle, and if anything was approaching a market correction and/or bear market.
Finally, valuation levels are clearly not cheap, as shown in the next chart.
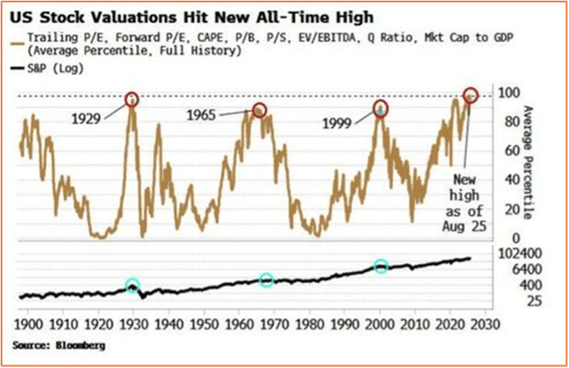
In past investment letters, I’ve included charts of the Shiller CAPE ratio and the Warren Buffett indicator, both of which have reflected exceptionally high valuation levels for equities. The chart above shows the average percentile of not just one or two, but eight valuation metrics (including the Shiller CAPE and Buffett indicator), with zero percentile inferring historic cheap levels and 100th percentile inferring historic expensive levels. This past August the percentile hit 100.
We could present several more charts making the same point, but in the interest of brevity, we’ll instead conclude by saying what we’ve been saying for the last few quarters. With respect to client portfolios, we remain defensively positioned as we are always being as mindful and vigilant about preserving capital as we are about striving to achieve significant relative performance gains.
If you have any questions, please feel free to call or email.
The entire team at Measured Wealth wishes to thank you for entrusting us to deliver on your financial goals.
Edward Miller, CFA, CMT
Chief Investment Officer
Measured Wealth Private Client Group
Important Disclosures
Historical data is not a guarantee that any of the events described will occur or that any strategy will be successful. Past performance is not indicative of future results.
Returns citied above are from various sources including Factset, Bloomberg, Russell Associates, S&P Dow Jones, MSCI Inc., The St. Louis Federal Reserve and Y-Charts, Inc. The content is developed from sources believed to be providing accurate information. The information in this material is not intended as tax or legal advice. Please consult legal or tax professionals for specific information regarding your individual situation. The opinions expressed and material provided are for general information and should not be considered a solicitation for the purchase or sale of any security. Investing involves risks, including possible loss of principal. Please consider the investment objectives, risks, charges, and expenses of any security carefully before investing.
In order to provide effective management of your account, it is important that we have current information regarding your financial status and circumstances. Please contact us in writing at 303 Islington Street, Portsmouth, NH 03801 if you have any changes in your financial situation or investment objectives, and whether you wish to impose any reasonable restrictions on the management of the account or reasonably modify existing restrictions.
Measured Wealth Private Client Group, LLC is an investment adviser located in Portsmouth, New Hampshire. Measured Wealth Private Client Group, LLC is registered with the Securities and Exchange Commission (SEC). Registration of an investment adviser does not imply any specific level of skill or training and does not constitute an endorsement of the firm by the Commission. Measured Wealth Private Client Group, LLC only transacts business in states in which it is properly registered or is excluded or exempted from registration.
This publication is provided to clients and prospective clients of Measured Wealth Private Client Group, LLC for general informational and educational purposes only. It does not: (i) consider any person's individual needs, objectives, or circumstances; (ii) contain a recommendation, offer, or solicitation to buy or sell securities, or to enter into an agreement for investment advisory services; or (iii) constitute investment advice on which any person should or may rely. Past performance is no indication of future investment results. This publication is based on information obtained from third parties. While Measured Wealth Private Client Group, LLC seeks information from sources it believes to be reliable, Measured Wealth Private Client Group, LLC has not verified, and cannot guarantee the accuracy, timeliness, or completeness, of the third-party information used in preparing this publication. The third-party information and this publication are provided on an “as is” basis without warranty.
This publication may contain forward-looking statements relating to the objectives, opportunities, and the future performance of the U.S. market generally. Forward-looking statements may be identified by the use of such words as; “should,” “estimated,” “potential” and other similar terms. Examples of forward-looking statements include, but are not limited to, estimates with respect to financial condition, results of operations, and success or lack of success of any particular investment strategy. All are subject to various factors, including, but not limited to general and local economic conditions, changing levels of competition within certain industries and markets, changes in interest rates, changes in legislation or regulation, and other economic, competitive, governmental, regulatory and technological factors affecting a portfolio's operations that could cause actual results to differ materially from projected results. Such statements are forward-looking in nature and involve a number of known and unknown risks, uncertainties and other factors, and accordingly, actual results may differ materially from those reflected or contemplated in such forward-looking statements. Prospective investors are cautioned not to place undue reliance on any forward-looking statements or examples. None of Measured Wealth Private Client Group, LLC or any of its affiliates or principals nor any other individual or entity assumes any obligation to update any forward-looking statements as a result of new information, subsequent events or any other circumstances. All statements made herein speak only as of the date that they were made.