Another month in the books and once again stocks post more gains. October came to a close with the S&P 500 rising by 2.3%, making it six consecutive months of positive returns. Not to be outdone, non-US stocks continued to outperform US stocks this year as the MSCI Emerging Markets Index rose 3.6% in October, generating positive returns every month this year and up a stellar 33.5% year-to-date (YTD).
Although major equity indices have been making new all-time highs, more recently several measures of breadth or market participation have been exhibiting worrisome signs. For example, in October, only one sector (Technology) out of eleven outperformed the S&P 500. That’s it, just one sector. Talk about narrow market leadership!
In addition, as shown in the following chart, at the end of last month, the S&P 500 experienced its worst breadth since 1990.
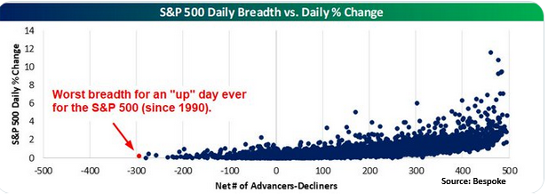
On October 28th, the S&P 500 finished positive for the day, but the breadth was atrocious as 104 stocks in the Index were up but 396 stocks finished the day lower. In other words, the S&P 500 Index enjoyed a positive trading day, however nearly 80% of the names in the Index finished the day lower. Just about 20% of index members were responsible for the gains – a level of weak market participation not seen in decades.
Another way to represent breadth is shown in this next chart:
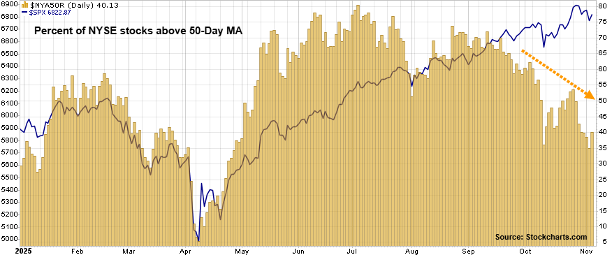
The blue line is the S&P 500 and the gold vertical bars reflect the percentage of NYSE stocks that are trading above their 50-day moving average (MA). Healthy bull markets typically have a majority of stocks trading above key moving averages, indicating most stocks are in uptrends. As depicted in the above chart, whereas the percentage of NYSE stocks above their 50-day MA was well north of 70% during much of the summer months, that percentage has gradually been declining as currently just 40% of NYSE stocks are above their 50-day MA. Such a bearish divergence paints a picture of fewer stocks participating as equity indices climb to new heights. When market breadth narrows to this degree, the underpinnings of the bull market are arguably on shaky ground.
In addition to weak breadth, another area of concern involves the stocks faring the best during this prolonged market rally.
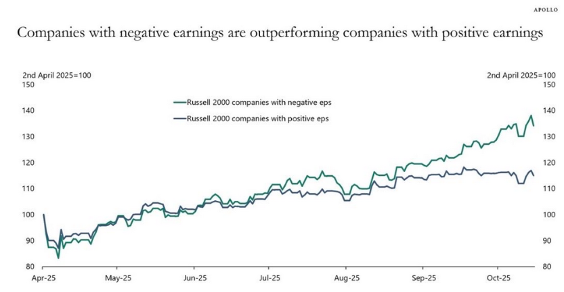
The chart above considers stocks in the small-cap Russell 2000 Index. The green line represents those member companies in the Index that have negative earnings (unprofitable) and the blue line represents those member companies that have positive earnings. Since the market low in early April, these two lines were tracking closely, but starting in July the return for negative earners has pulled away from the positive earners.
And this is not just a small-cap phenomena. Negative-earners in the large-cap Russell 1000 Index returned an average of 47% since the early April market low, compared to just a 29% average return for the positive earners.
When stocks of unprofitable companies are trouncing the returns of profitable companies, it tends to signify that investor sentiment is extremely optimistic and even complacent. By purchasing the shares of companies with negative earnings, investors are taking a leap of faith that profitability will come in due time. Yet, all too often, this hope can be misplaced. As equity indices hit new highs, investors can get caught up in the euphoria of the moment and toss caution to the wind. As we’ve discussed in past letters, investor sentiment is a contrary indicator, meaning it’s generally best to take the opposite stance. If the majority are extremely bullish, history has shown that it’s best to remain prudent and wary during such times.
If you have any questions, please feel free to call or email.
The entire team at Measured Wealth wishes to thank you for entrusting us to deliver on your financial goals.
Edward Miller, CFA, CMT
Chief Investment Officer
Measured Wealth Private Client Group
Important Disclosures
Historical data is not a guarantee that any of the events described will occur or that any strategy will be successful. Past performance is not indicative of future results.Returns citied above are from various sources including Factset, Bloomberg, Russell Associates, S&P Dow Jones, MSCI Inc., The St. Louis Federal Reserve and Y-Charts, Inc. The content is developed from sources believed to be providing accurate information. The information in this material is not intended as tax or legal advice. Please consult legal or tax professionals for specific information regarding your individual situation. The opinions expressed and material provided are for general information and should not be considered a solicitation for the purchase or sale of any security. Investing involves risks, including possible loss of principal. Please consider the investment objectives, risks, charges, and expenses of any security carefully before investing.
In order to provide effective management of your account, it is important that we have current information regarding your financial status and circumstances. Please contact us in writing at 303 Islington Street, Portsmouth, NH 03801 if you have any changes in your financial situation or investment objectives, and whether you wish to impose any reasonable restrictions on the management of the account or reasonably modify existing restrictions.
Measured Wealth Private Client Group, LLC is an investment adviser located in Portsmouth, New Hampshire. Measured Wealth Private Client Group, LLC is registered with the Securities and Exchange Commission (SEC). Registration of an investment adviser does not imply any specific level of skill or training and does not constitute an endorsement of the firm by the Commission. Measured Wealth Private Client Group, LLC only transacts business in states in which it is properly registered or is excluded or exempted from registration.
This publication is provided to clients and prospective clients of Measured Wealth Private Client Group, LLC for general informational and educational purposes only. It does not: (i) consider any person's individual needs, objectives, or circumstances; (ii) contain a recommendation, offer, or solicitation to buy or sell securities, or to enter into an agreement for investment advisory services; or (iii) constitute investment advice on which any person should or may rely. Past performance is no indication of future investment results. This publication is based on information obtained from third parties. While Measured Wealth Private Client Group, LLC seeks information from sources it believes to be reliable, Measured Wealth Private Client Group, LLC has not verified, and cannot guarantee the accuracy, timeliness, or completeness, of the third-party information used in preparing this publication. The third-party information and this publication are provided on an “as is” basis without warranty.
This publication may contain forward-looking statements relating to the objectives, opportunities, and the future performance of the U.S. market generally. Forward-looking statements may be identified by the use of such words as; “should,” “estimated,” “potential” and other similar terms. Examples of forward-looking statements include, but are not limited to, estimates with respect to financial condition, results of operations, and success or lack of success of any particular investment strategy. All are subject to various factors, including, but not limited to general and local economic conditions, changing levels of competition within certain industries and markets, changes in interest rates, changes in legislation or regulation, and other economic, competitive, governmental, regulatory and technological factors affecting a portfolio's operations that could cause actual results to differ materially from projected results. Such statements are forward-looking in nature and involve a number of known and unknown risks, uncertainties and other factors, and accordingly, actual results may differ materially from those reflected or contemplated in such forward-looking statements. Prospective investors are cautioned not to place undue reliance on any forward-looking statements or examples. None of Measured Wealth Private Client Group, LLC or any of its affiliates or principals nor any other individual or entity assumes any obligation to update any forward-looking statements as a result of new information, subsequent events or any other circumstances. All statements made herein speak only as of the date that they were made.

.png?width=352&name=Miller%20Commentary%20featured%20image%20(4).png)
